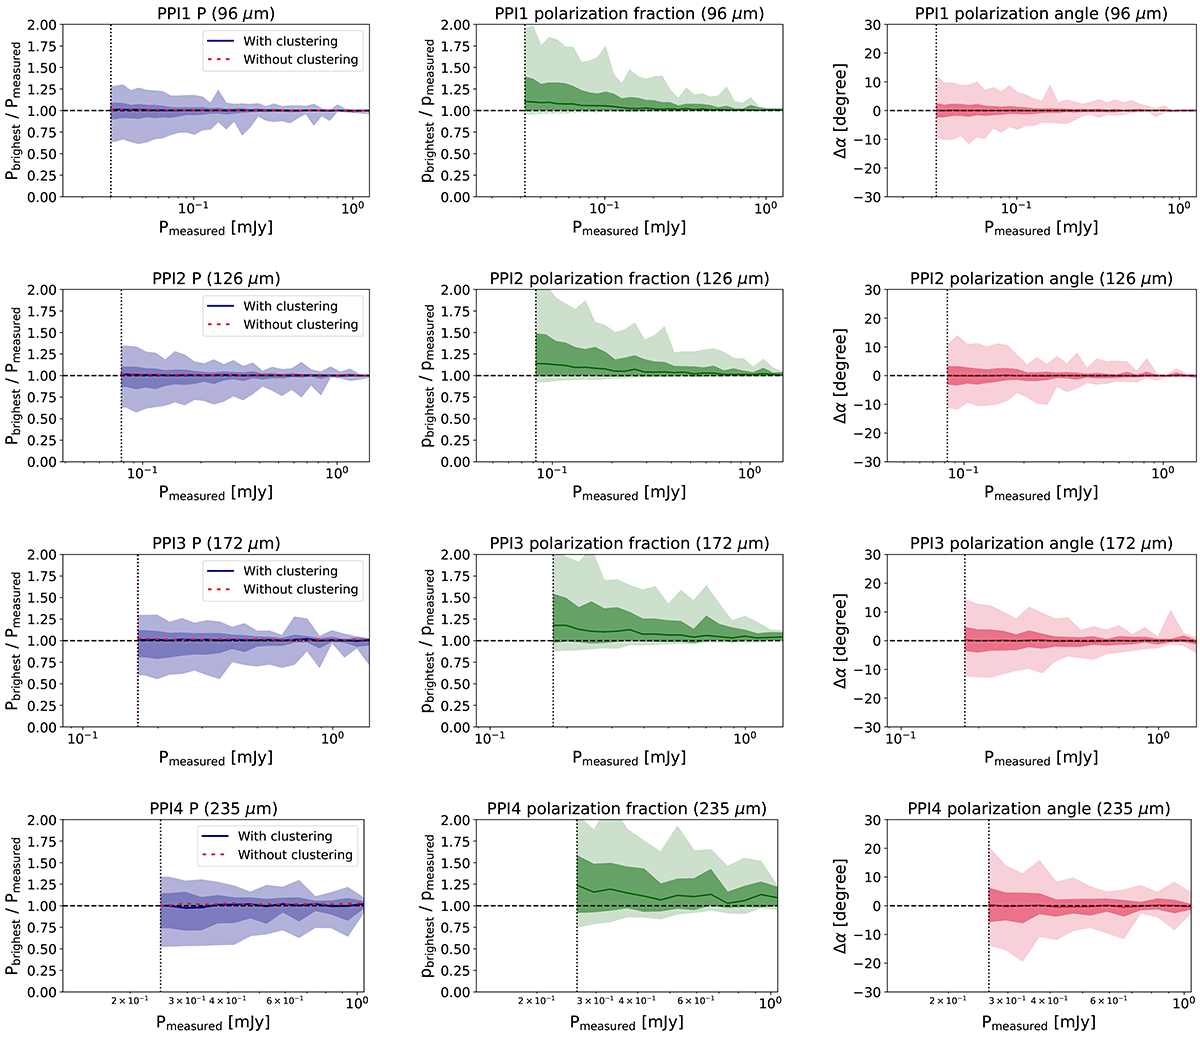
Fig. 8.
Download original image
Performance of the integrated polarization measurements. Left panels: ratio between the polarized flux density P of the brightest simulated galaxy in the beam and the measured one in the P map. The symbols are the same as in Fig. 3. Central panels: same thing for the polarized fraction p. Right panels: difference between the polarization angle α of the brightest source in the beam (see Sect. 2.3) and the measured angle. The rows correspond to the various polarized band from PPI1 to PPI4.
Current usage metrics show cumulative count of Article Views (full-text article views including HTML views, PDF and ePub downloads, according to the available data) and Abstracts Views on Vision4Press platform.
Data correspond to usage on the plateform after 2015. The current usage metrics is available 48-96 hours after online publication and is updated daily on week days.
Initial download of the metrics may take a while.