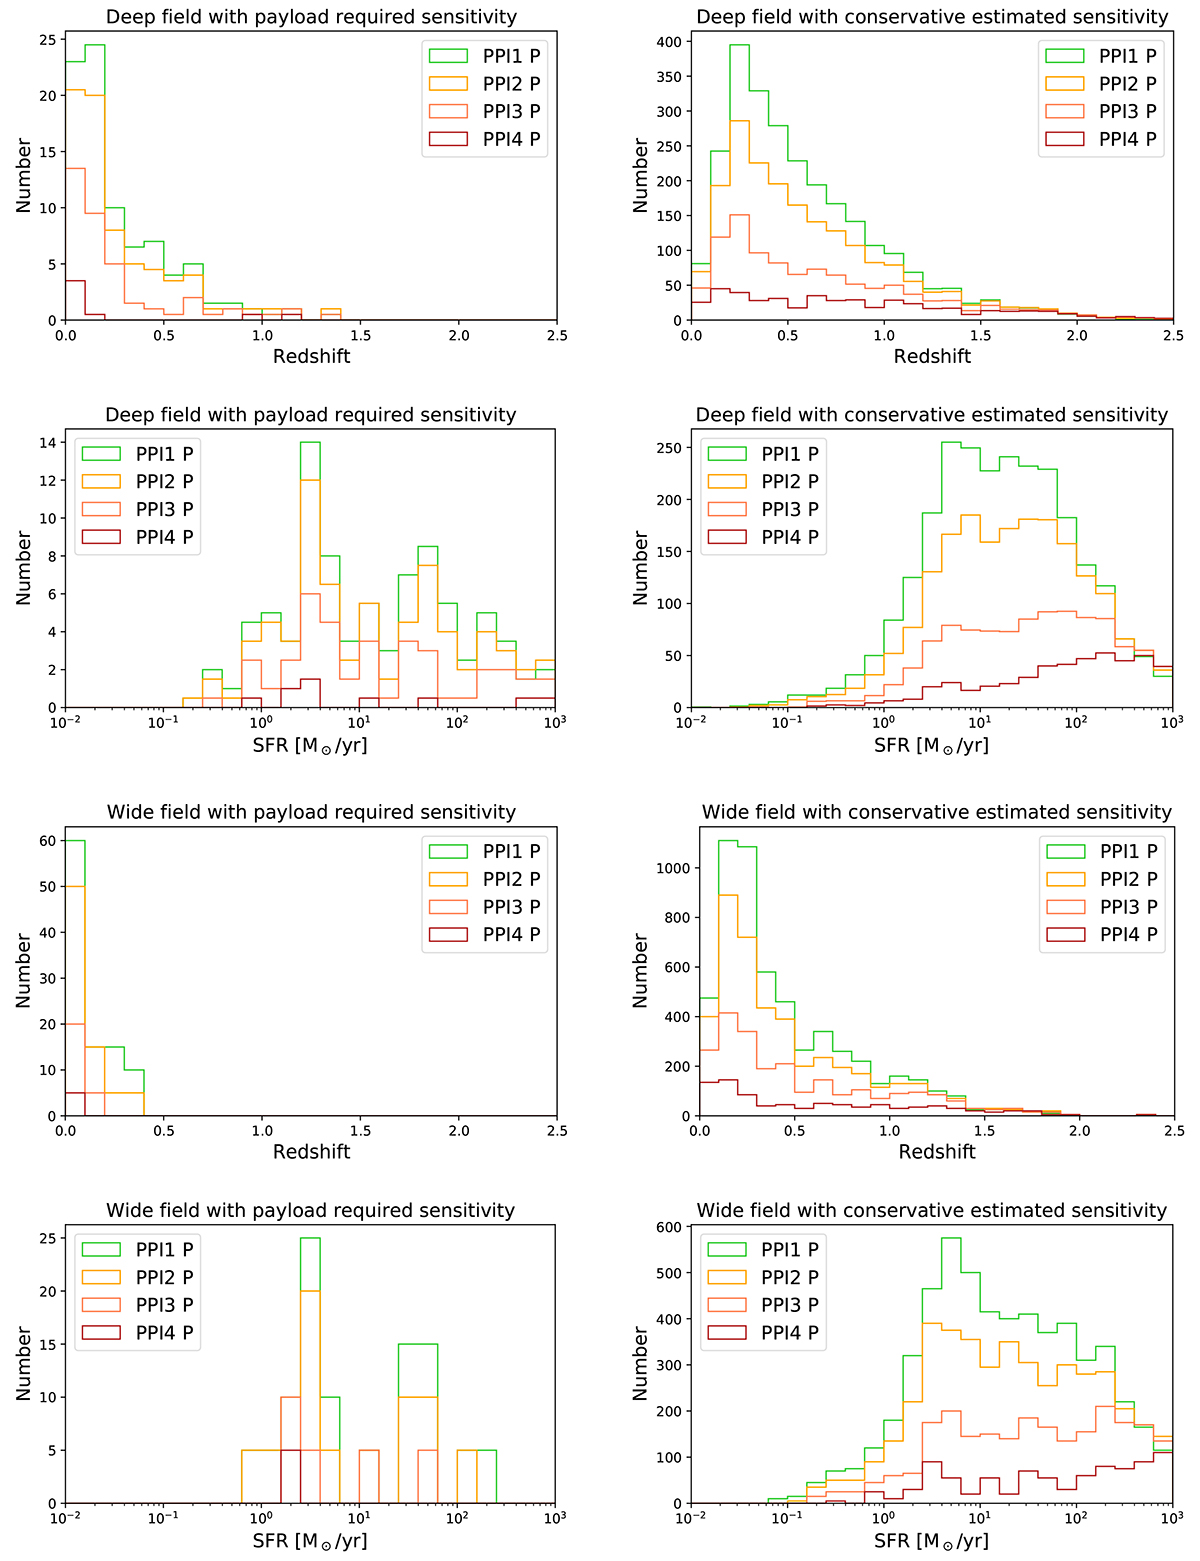
Fig. 13.
Download original image
Redshift and SFR distributions of the sources above the detection limit in polarized flux density Plim (see Table 4 and Sect. 6.2). The left columns correspond to the required payload sensitivity and the right ones to the conservative estimated sensitivity. The rows are from top to bottom: redshift distribution in the deep field, SFR distribution in the deep field, redshift distribution in the wide field, SFR distribution in the wide field. The bands are color-coded, as is indicated in the figure.
Current usage metrics show cumulative count of Article Views (full-text article views including HTML views, PDF and ePub downloads, according to the available data) and Abstracts Views on Vision4Press platform.
Data correspond to usage on the plateform after 2015. The current usage metrics is available 48-96 hours after online publication and is updated daily on week days.
Initial download of the metrics may take a while.