Fig. 6
Download original image
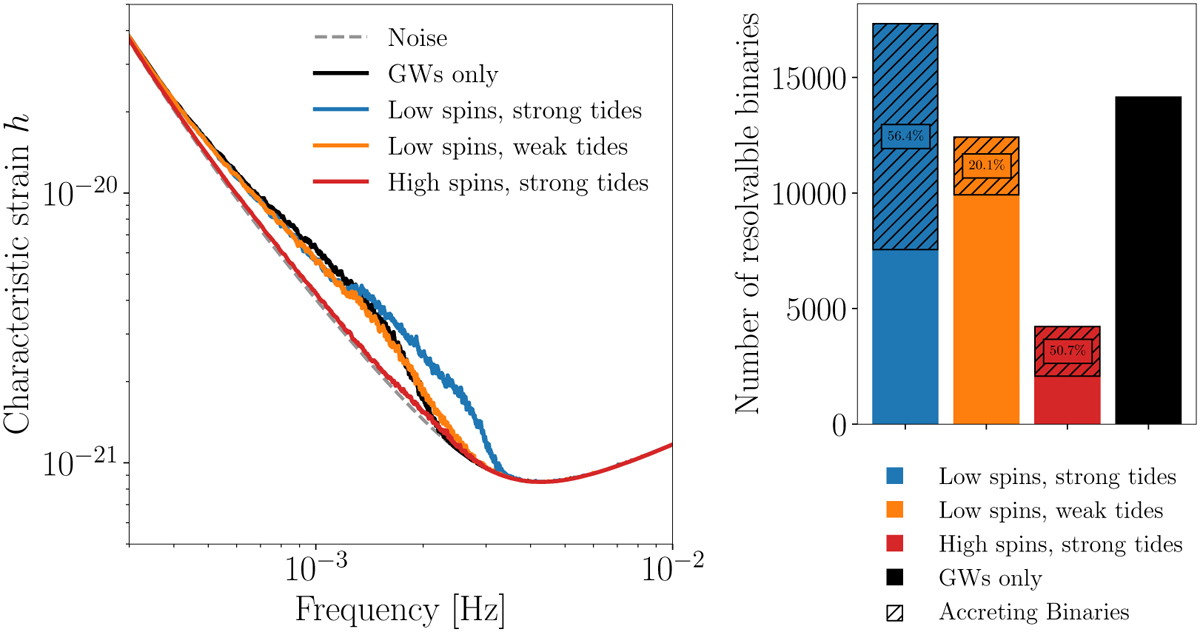
LISA results obtained with the subtraction algorithm in different scenarios, indicated by colours. Left: characteristic strain of the total noise power spectral density ![]() , including the instrumental and the DWD confusion noise, compared to the instrumental noise alone, in grey dashed lines. Right: number of resolvable sources in each of the considered scenarios. Hatches indicate how many of those are accreting. We find 56.4%, 20.1%, and 50.7%; of the resolvable systems to be accreting in the ‘low spins, strong tides’, ‘low spins, weak tides’, and ‘high spins, strong tides’ scenarios, respectively, as indicated by the boxed numbers.
, including the instrumental and the DWD confusion noise, compared to the instrumental noise alone, in grey dashed lines. Right: number of resolvable sources in each of the considered scenarios. Hatches indicate how many of those are accreting. We find 56.4%, 20.1%, and 50.7%; of the resolvable systems to be accreting in the ‘low spins, strong tides’, ‘low spins, weak tides’, and ‘high spins, strong tides’ scenarios, respectively, as indicated by the boxed numbers.
Current usage metrics show cumulative count of Article Views (full-text article views including HTML views, PDF and ePub downloads, according to the available data) and Abstracts Views on Vision4Press platform.
Data correspond to usage on the plateform after 2015. The current usage metrics is available 48-96 hours after online publication and is updated daily on week days.
Initial download of the metrics may take a while.