Open Access
Fig. 1
Download original image
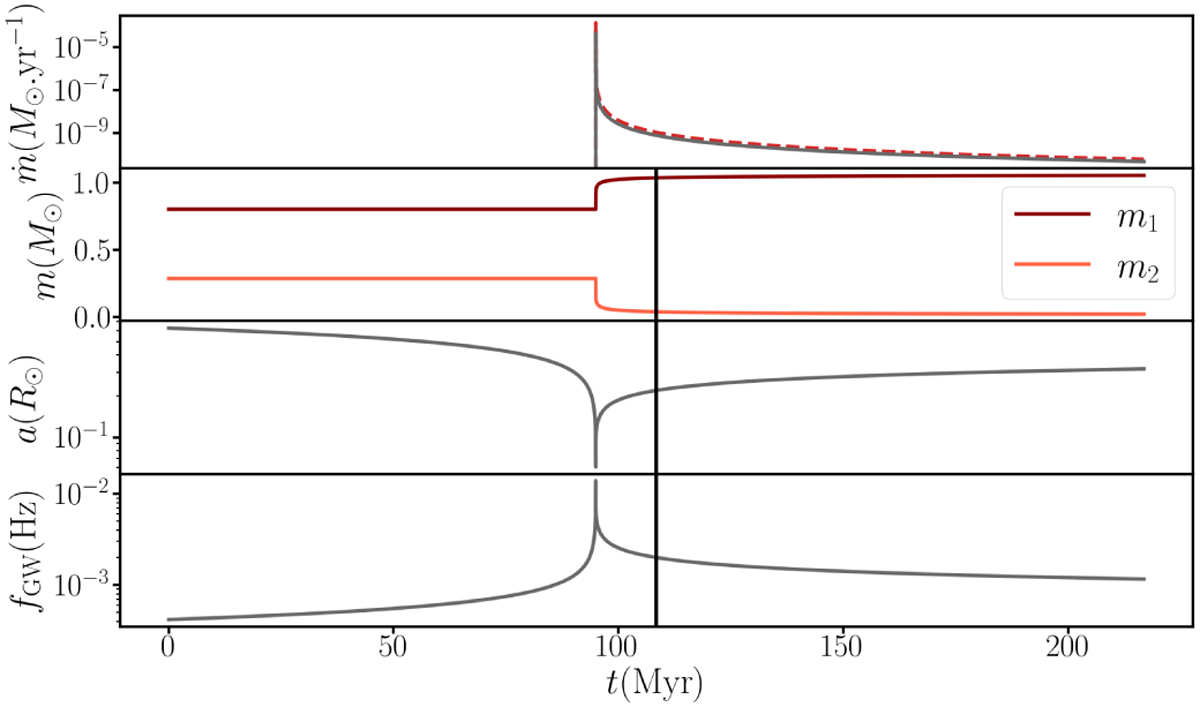
Evolution for a system with m1,0 = 0.80 M⊙ and m2,0 = 0.29 M⊙, and τs,ref = 104 yr, ω1,0 = ω2,0 = 0. The black vertical line shows the time the binary has to evolve between its formation and today. To show its long-term trajectory, we extend the evolutionary simulation beyond this timeframe.
Current usage metrics show cumulative count of Article Views (full-text article views including HTML views, PDF and ePub downloads, according to the available data) and Abstracts Views on Vision4Press platform.
Data correspond to usage on the plateform after 2015. The current usage metrics is available 48-96 hours after online publication and is updated daily on week days.
Initial download of the metrics may take a while.