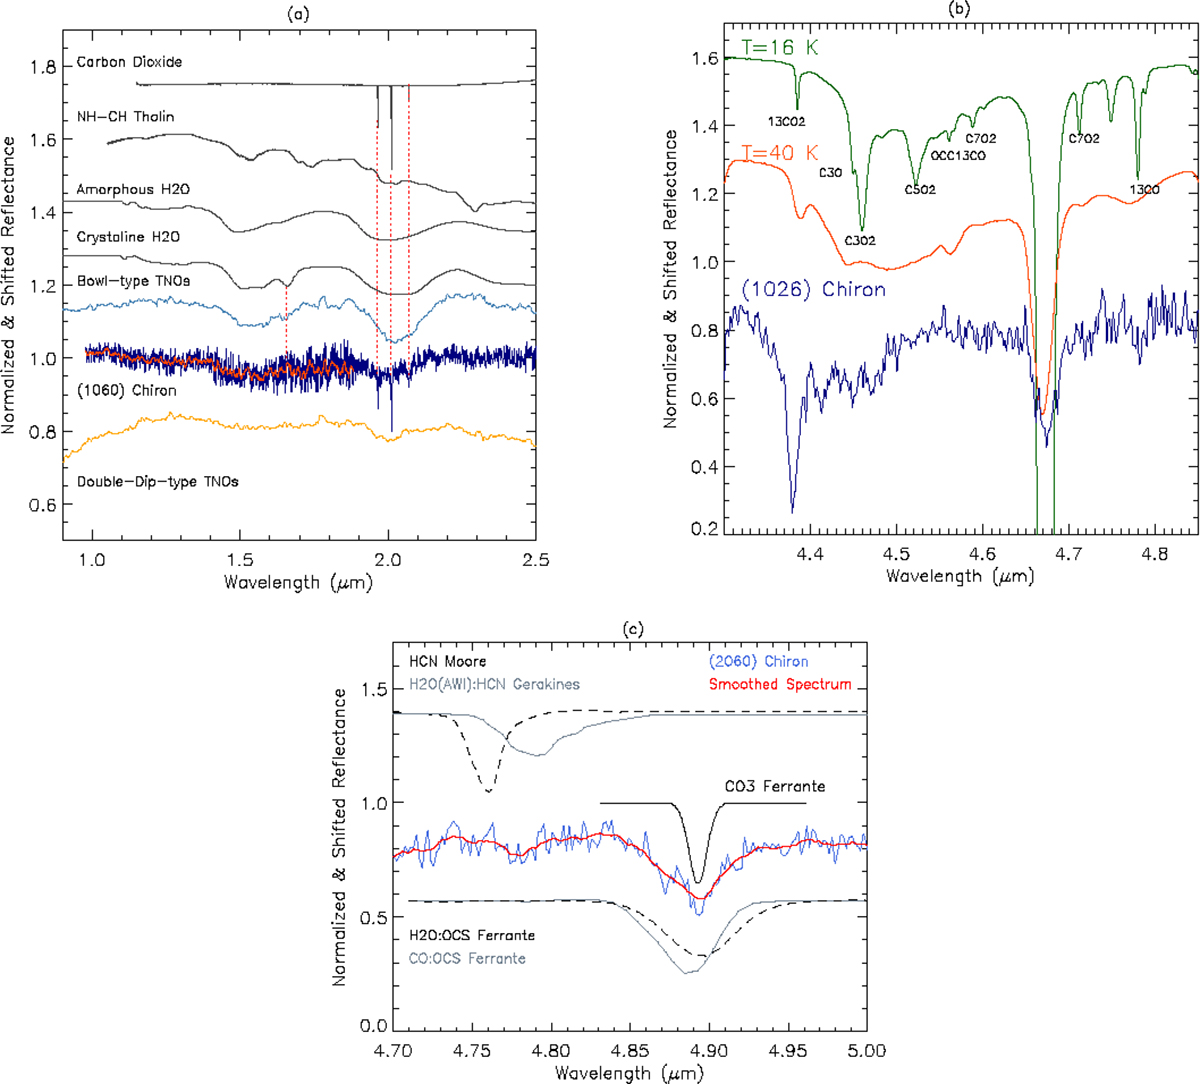
Fig. C.2.
Download original image
Ice detections in Chiron’s spectrum. (a) Chiron’s spectrum compared to the median of the Bowl- and double-dip type TNOs (Pinilla-Alonso et al. 2024). We also include the reflectance spectrum of amorphous and crystalline water ice (Mastrapa 2010), CO2 (Henault personal communication), and tholins formed from irradiation -NH and -CH ices (Henault personal communication). The three colored reflectances have been divided by their continuum between 1.1 and 2.5 μm for a better visual comparison of the 1.5 and 2.0 μm absorption bands. Chiron’s smooth spectrum appears in red in the G140M/F100LP (0.97–1.89 μm) wavelength range to better compare with the profile of the amorphous and crystalline water ice band at 1.52 μm. (b) Chiron’s spectrum compared to the spectrum of the irradiation products of pure CO at 16 and 40 K from (Palumbo et al. 2008). (c) Chiron’s spectrum compared with reflectance of HCN pure (Moore et al. 2010) and mixed with H2O (Gerakines et al. 2022), CO3 (Ferrante et al. 2008) and OCS (Ferrante et al. 2008). All the reflectances have been rescaled and shifted vertically for clarity.
Current usage metrics show cumulative count of Article Views (full-text article views including HTML views, PDF and ePub downloads, according to the available data) and Abstracts Views on Vision4Press platform.
Data correspond to usage on the plateform after 2015. The current usage metrics is available 48-96 hours after online publication and is updated daily on week days.
Initial download of the metrics may take a while.