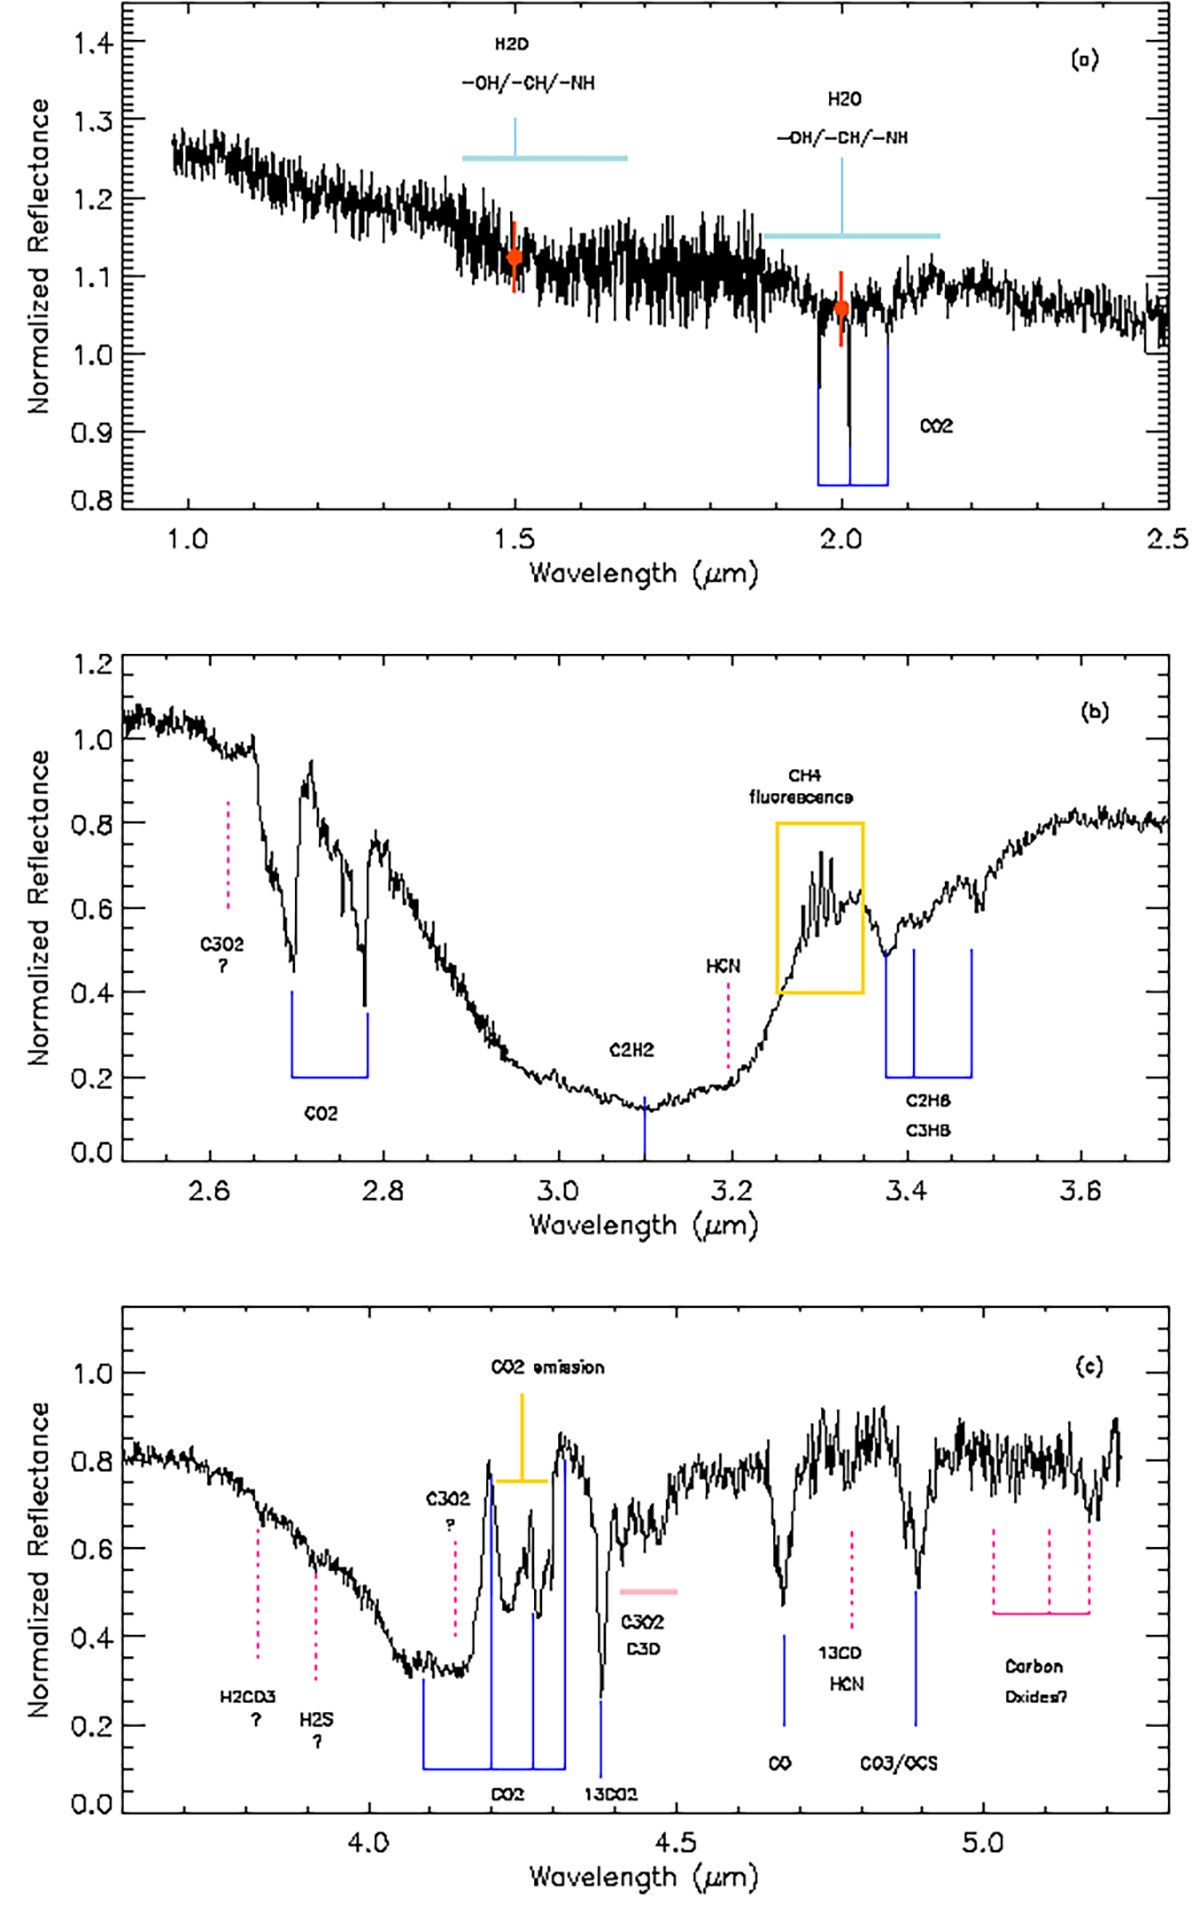
Fig. 3.
Download original image
Chiron’s spectrum obtained with the G140M/F100LP (top), G235M/F140LP (middle), and G395M/F290LP (bottom) grisms of NIRSpec. Clear attributions for the absorption bands are signaled in solid blue lines and tentative ones in dotted pink lines. The red dots at 1.5 and 2.0 μm in the top panel represent the 1.5 and 3.0σ error bars, respectively, calculated with the standard deviation around the center of each band.
Current usage metrics show cumulative count of Article Views (full-text article views including HTML views, PDF and ePub downloads, according to the available data) and Abstracts Views on Vision4Press platform.
Data correspond to usage on the plateform after 2015. The current usage metrics is available 48-96 hours after online publication and is updated daily on week days.
Initial download of the metrics may take a while.