Fig. 9
Download original image
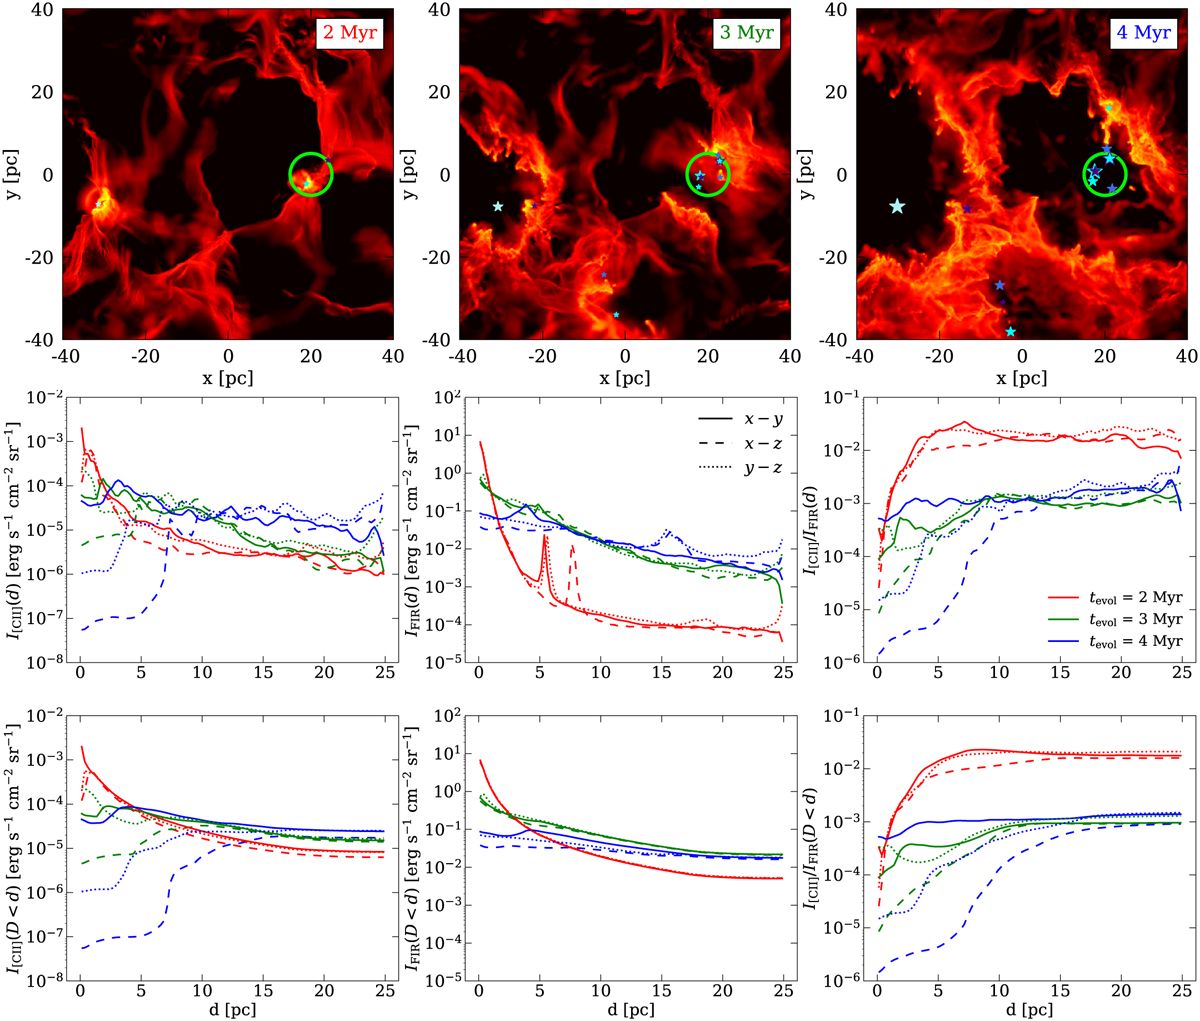
[CII] intensity maps and profiles for MC2-HD at different times. Top row: maps of I[CII] for MC2-HD (x − ɀ plane) at tevol = 2–4 Myr (from left to right). Stars are represented using the same symbols as in Fig. 4. The green circles show the stars which are responsible for creating the HII region of interest, i.e. bubble 2 (see Table 3), inspected in the middle and bottom row. Middle row: average I[CII], IFIR, and I[CII]/IFIR at a given distance d from the main star within the HII region highlighted by the green circles in the upper row. Solid, dashed, and dotted lines represent the values for the x − y, x − ɀ, and y − ɀ plane, respectively. Bottom row: same as in middle row, but now for an average over all points with a distance D < d.
Current usage metrics show cumulative count of Article Views (full-text article views including HTML views, PDF and ePub downloads, according to the available data) and Abstracts Views on Vision4Press platform.
Data correspond to usage on the plateform after 2015. The current usage metrics is available 48-96 hours after online publication and is updated daily on week days.
Initial download of the metrics may take a while.