Fig. 7
Download original image
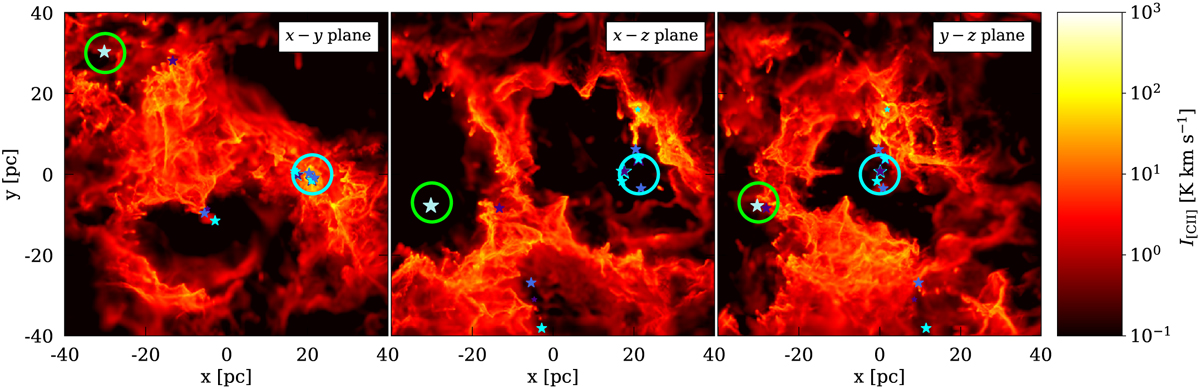
[CII] emission map of MC2-HD at tevol = 4 Myr for three different LOSs. The green and cyan circles highlight the stars (see Fig. 4 for a legend of the star symbols) responsible for the formation of ‘bubble 1’ and ‘bubble 2’, respectively. Because of the complex structure of the cloud, the shape of such HII regions is strongly dependent on the chosen LOS. As an example, “bubble 2” is not visible at all when looking along the z-axis (left panel). This explains the variations of the [CII] deficit as a function of the bubble radius for different LOS (Fig. 10).
Current usage metrics show cumulative count of Article Views (full-text article views including HTML views, PDF and ePub downloads, according to the available data) and Abstracts Views on Vision4Press platform.
Data correspond to usage on the plateform after 2015. The current usage metrics is available 48-96 hours after online publication and is updated daily on week days.
Initial download of the metrics may take a while.