Fig. 5
Download original image
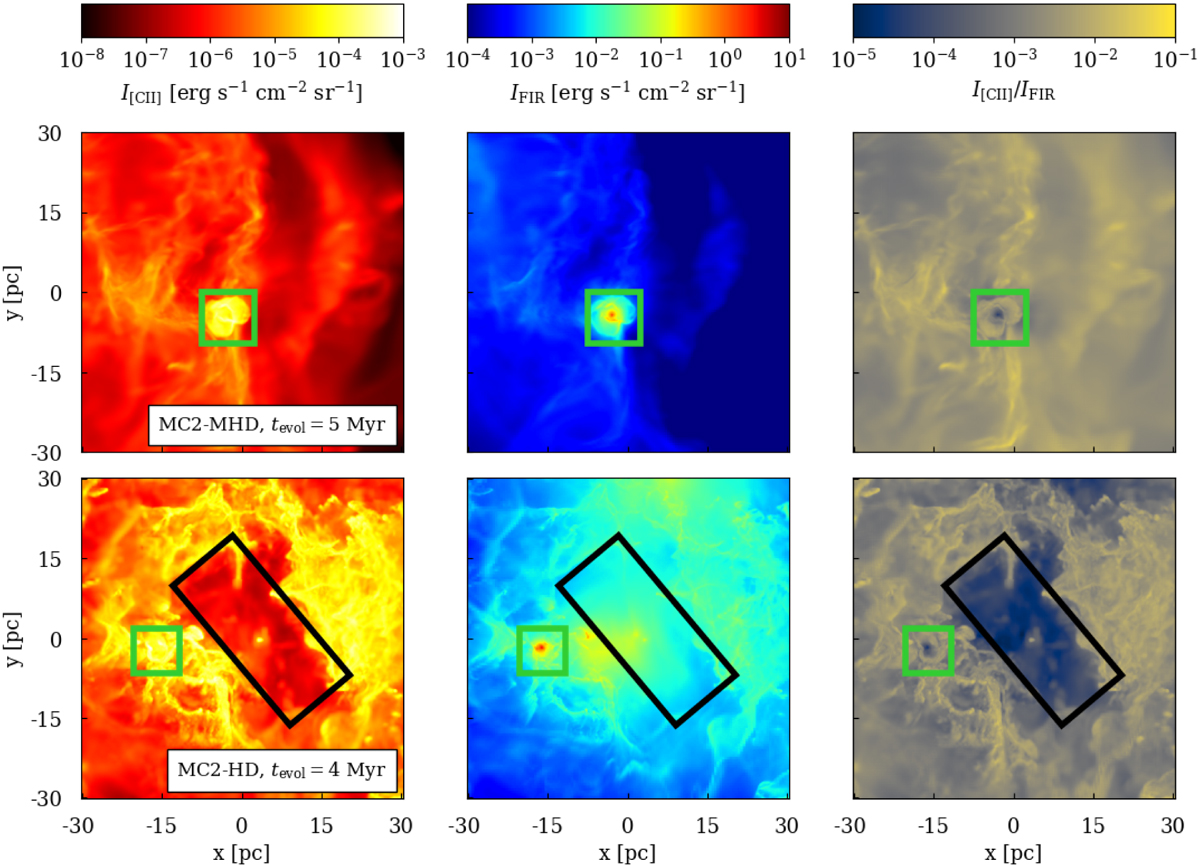
Emission maps of I[CII] and IFIR, and maps of I[CII]/IFIR, for MC2-MHD, tevol = 5 Myr (top), and MC2-HD, tevol = 4 Myr (bottom). In the very young HII regions highlighted with a green rectangle, the low [CII]/FIR ratio is mostly due to the high IFIR. Conversely, the black rectangle highlights a more developed HII region, where the [CII] deficit is mainly caused by the C+ → C2+ ionisation due to stellar radiation.
Current usage metrics show cumulative count of Article Views (full-text article views including HTML views, PDF and ePub downloads, according to the available data) and Abstracts Views on Vision4Press platform.
Data correspond to usage on the plateform after 2015. The current usage metrics is available 48-96 hours after online publication and is updated daily on week days.
Initial download of the metrics may take a while.