Fig. 4
Download original image
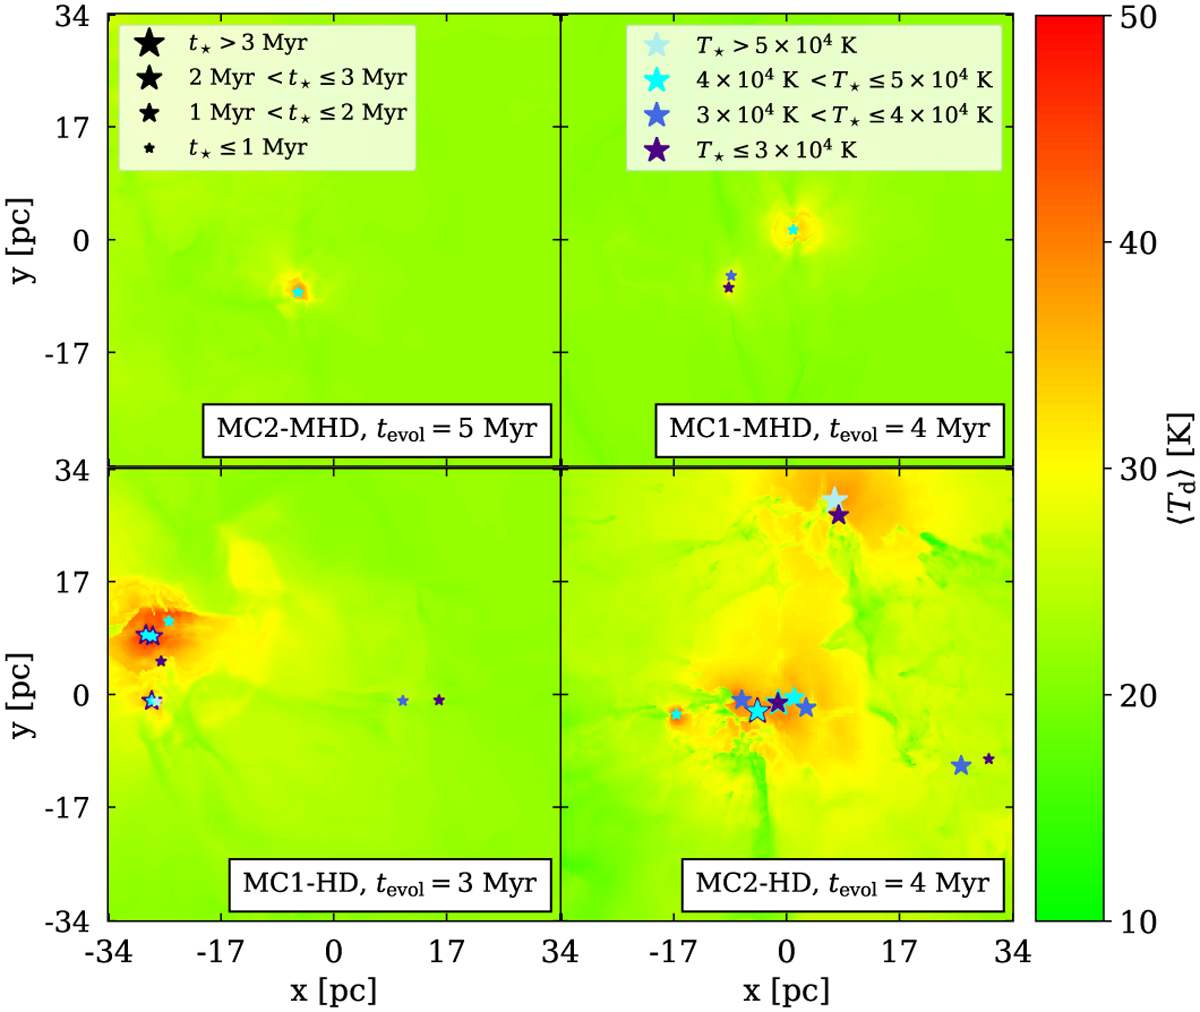
Maps of the mass-weighted mean dust temperature, 〈Td〉, for four snapshots of the simulated clouds. We show, from top left to bottom right, MCs with progressively more advanced star formation. We overplot the stars present in the simulations, where the size and colour indicate the age and temperature of the stars, respectively. In general, regions not affected by stellar feedback have 〈Td〉 ≃ 15 K, and regions where stellar feedback is important have 〈Td〉 ≃ 50 K. These regions are small (a few pc) and limited to the direct vicinity of the stars in the early stages of star formation (e.g. MC2-MHD, top left), but involve larger parts of the cloud (a few 10 pc) at later stages (e.g. MC2-HD, bottom right).
Current usage metrics show cumulative count of Article Views (full-text article views including HTML views, PDF and ePub downloads, according to the available data) and Abstracts Views on Vision4Press platform.
Data correspond to usage on the plateform after 2015. The current usage metrics is available 48-96 hours after online publication and is updated daily on week days.
Initial download of the metrics may take a while.