Fig. 16
Download original image
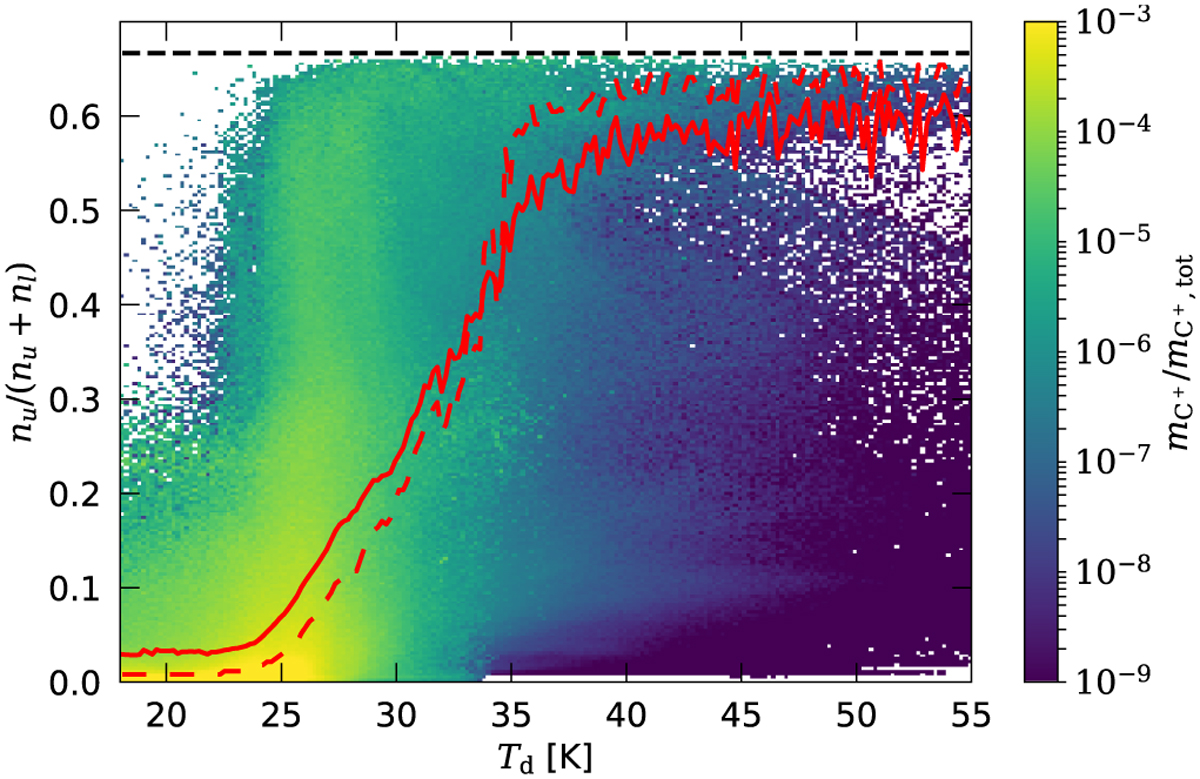
Mass-weighted 2D histogram of the fraction of C+ ions in the 2P3/2 level (nu/(nu + nl)) as a function of the dust temperature Td. The solid red line represents the mass-weighted average of nu/(nu + nl) for a given Td bin, and the dashed line represents the median. The thin, dotted black line represents nu/(nu + nl) = 2/3, that is, the maximum possible value. We show the result for MC2-HD at tevol = 4 Myr, with 18 K ≤ Td ≤ 55 K. On average, C+ reaches rough saturation at Td ≃ 40 K. This confirms that, in vicinity of stars, the [CII] line is saturated, causing, in part, the [CII] deficit.
Current usage metrics show cumulative count of Article Views (full-text article views including HTML views, PDF and ePub downloads, according to the available data) and Abstracts Views on Vision4Press platform.
Data correspond to usage on the plateform after 2015. The current usage metrics is available 48-96 hours after online publication and is updated daily on week days.
Initial download of the metrics may take a while.