Open Access
Fig. 14
Download original image
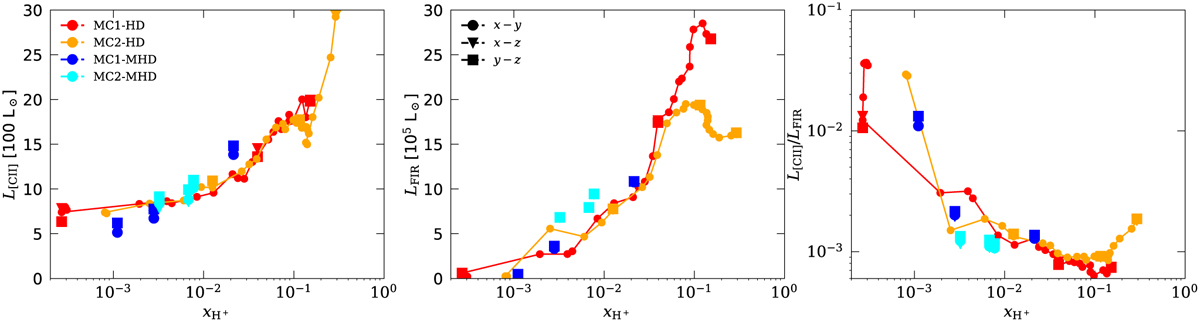
Same as Fig. 12, but as a function of ![]() . We note a general increase of L[CII] with increasing
. We note a general increase of L[CII] with increasing ![]() and a maximum in LFIR at
and a maximum in LFIR at ![]() in the two HD clouds. As a consequence, L[CII]/LFIR decreases for increasing
in the two HD clouds. As a consequence, L[CII]/LFIR decreases for increasing ![]() up to this point, and then increases again.
up to this point, and then increases again.
Current usage metrics show cumulative count of Article Views (full-text article views including HTML views, PDF and ePub downloads, according to the available data) and Abstracts Views on Vision4Press platform.
Data correspond to usage on the plateform after 2015. The current usage metrics is available 48-96 hours after online publication and is updated daily on week days.
Initial download of the metrics may take a while.