Fig. 13

Download original image
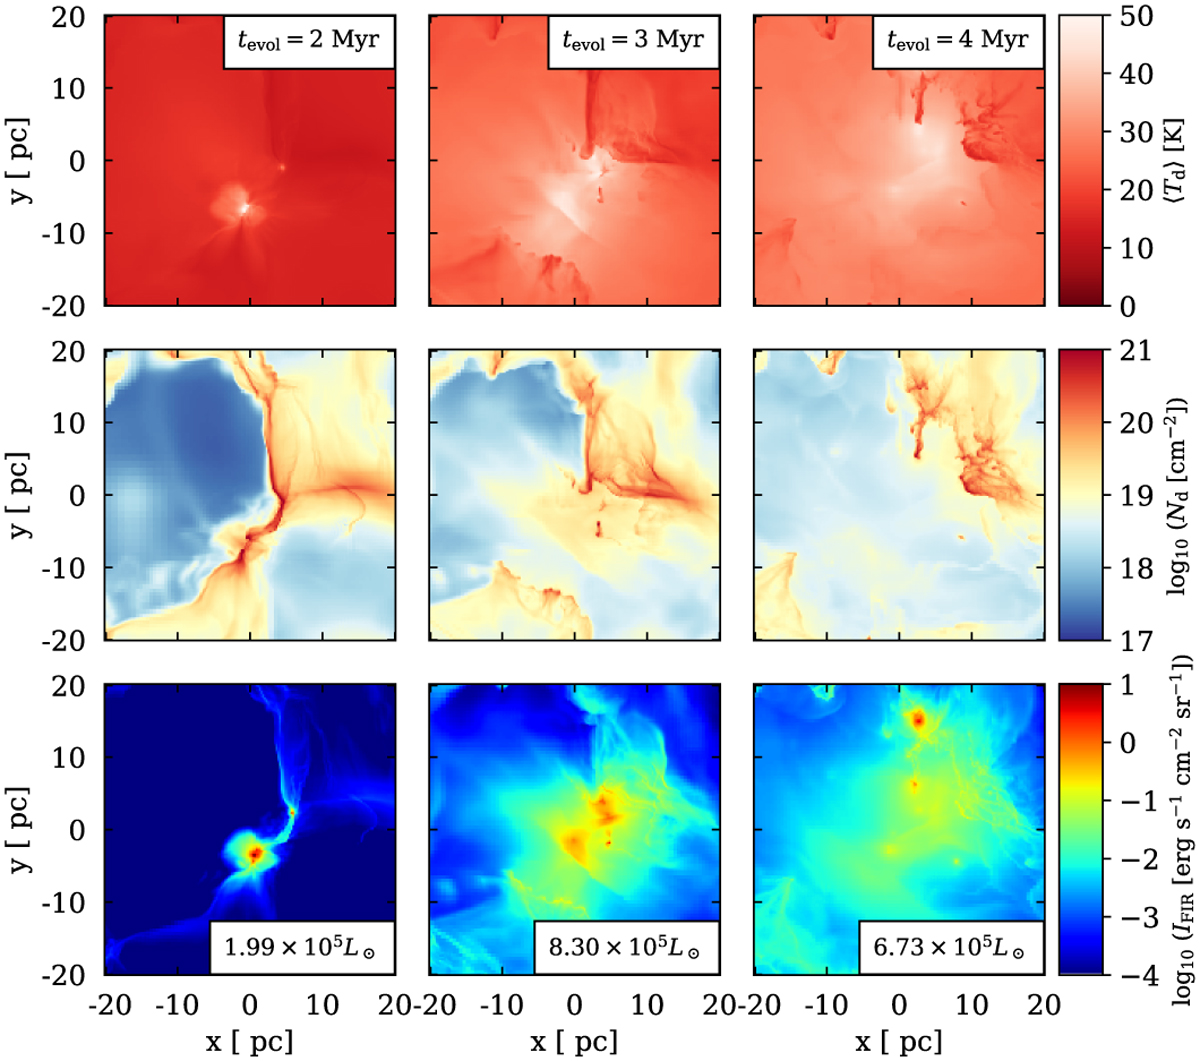
Mass-weighted dust temperature (〈Td〉, top row), dust column density (Nd, middle row), and FIR intensity (IFIR, bottom row) along the y-axis of a portion of MC2-HD centred around bubble 2 (see Table 3) at tevol = 2–4 Myr (from left to right). The expansion of the bubble progressively enlarges the region with warm dust, characterised by 〈Td〉 ≳ 20 K. However, Nd in the warm region is reduced by the expansion of the bubble, which pushes the dust into the much cooler shell of the bubble. As a consequence, IFIR arises from a progressively larger, but less FIR-bright area. This is also reflected in the total LFIR, reported for each snapshot in the IFIR maps.
Current usage metrics show cumulative count of Article Views (full-text article views including HTML views, PDF and ePub downloads, according to the available data) and Abstracts Views on Vision4Press platform.
Data correspond to usage on the plateform after 2015. The current usage metrics is available 48-96 hours after online publication and is updated daily on week days.
Initial download of the metrics may take a while.


