Fig. 11
Download original image
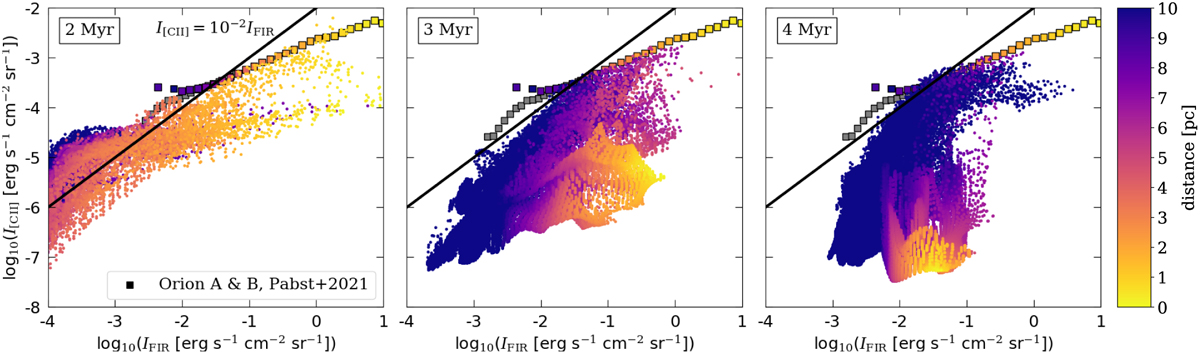
Distribution of I[CII] as a function of IFIR for all pixels within 10 pc from the main star of MC2-HD, bubble 2, in the x − ɀ plane. The colour bar indicates the distance from the main star. To guide the readers eye, we show with the black line a constant ratio of I[CII]/IFIR = 10−2. For pixels at close-by distances, the values of I[CII] and IFIR decrease over time due to the evacuation of the bubble, whereas at larger distances the values remain in a similar range. This leads to a separation into a “main branch”, formed by distant pixels, and a branch of close-by pixels, located below the main one. The squares show observational data from Orion A & B taken from Pabst et al. (2021, binned for the sake of readability) for comparison.
Current usage metrics show cumulative count of Article Views (full-text article views including HTML views, PDF and ePub downloads, according to the available data) and Abstracts Views on Vision4Press platform.
Data correspond to usage on the plateform after 2015. The current usage metrics is available 48-96 hours after online publication and is updated daily on week days.
Initial download of the metrics may take a while.