Fig. 5.
Download original image
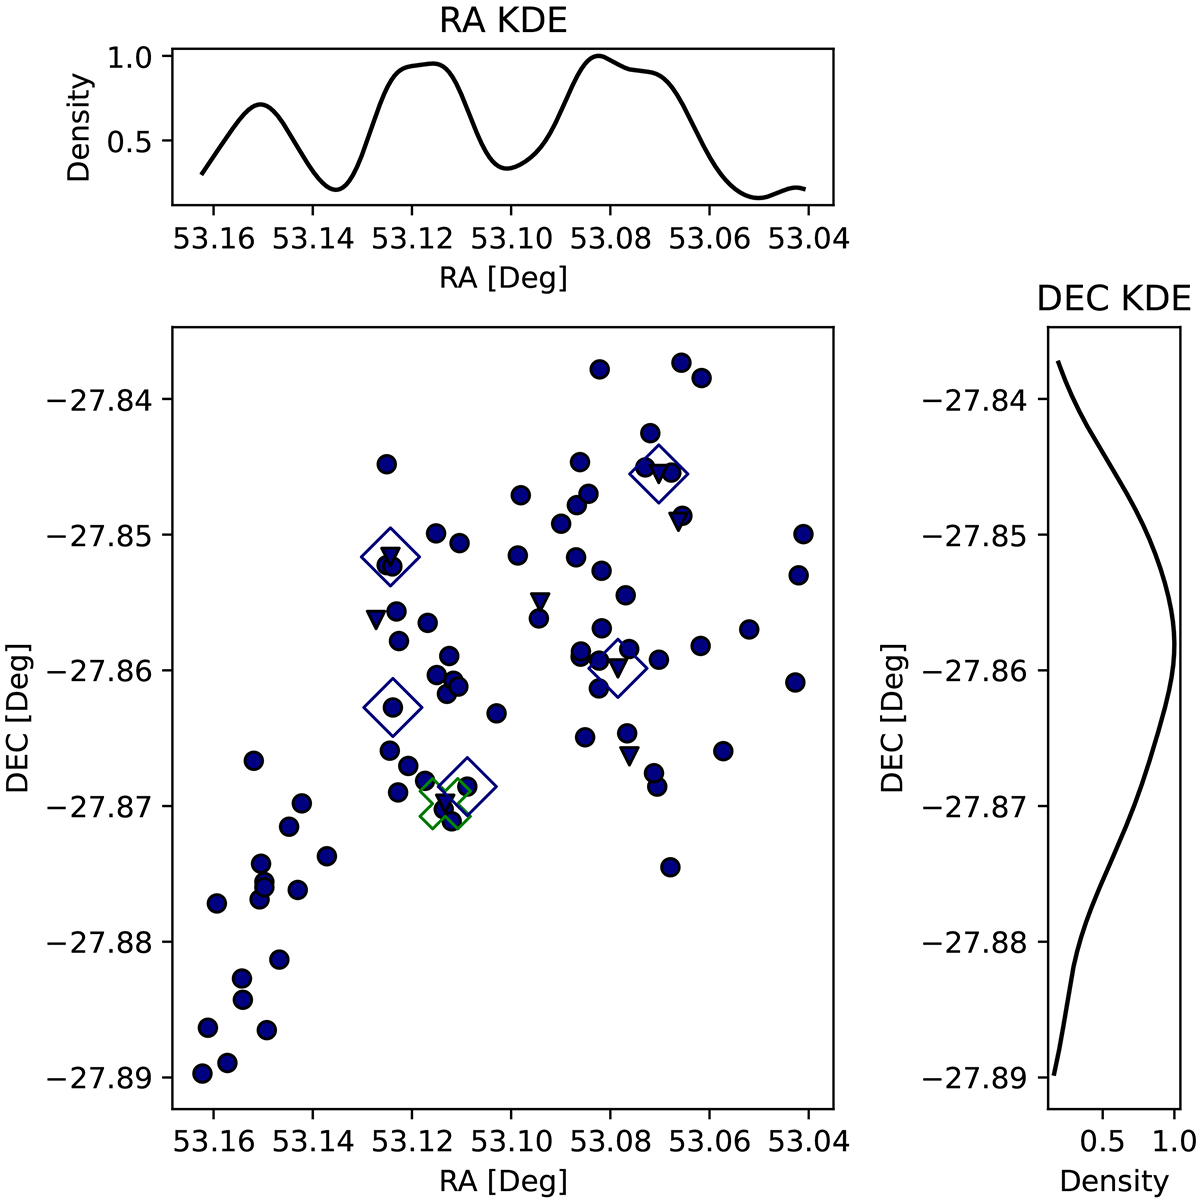
Central panel: spatial distribution of the galaxies in the z355 over-density. The galaxies are represented with different symbols based on their redshift, with circles for photometric redshifts and downward triangles for spectroscopic redshifts. Additionally, AGN are denoted with diamonds. Top and right panels: kernel density estimations (KDE) for the Dec. and for RA, respectively.
Current usage metrics show cumulative count of Article Views (full-text article views including HTML views, PDF and ePub downloads, according to the available data) and Abstracts Views on Vision4Press platform.
Data correspond to usage on the plateform after 2015. The current usage metrics is available 48-96 hours after online publication and is updated daily on week days.
Initial download of the metrics may take a while.