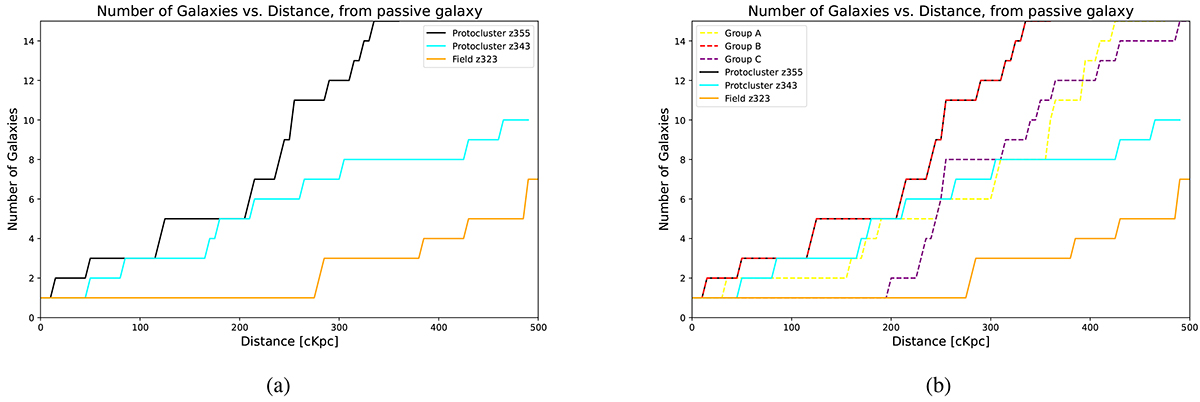
Fig. 4.
Download original image
Number of neighbors as a function of projected distance. The projected distance is calculated with respect to the passive galaxy hosted by the z343 over-density (cyan line), to the passive galaxy hosted by the z355 over-density (black line), and to the passive galaxy, from the literature, located in the field around the z323 over-density (orange line) in both the left and right panels. The right panel also shows the number of neighbor as a function of projected distance from the passive galaxies, from the literature, identified in the subgroups of the z355 over-density (yellow and purple dashed lines). (a) Overdensties. (b) Group Differentiation.
Current usage metrics show cumulative count of Article Views (full-text article views including HTML views, PDF and ePub downloads, according to the available data) and Abstracts Views on Vision4Press platform.
Data correspond to usage on the plateform after 2015. The current usage metrics is available 48-96 hours after online publication and is updated daily on week days.
Initial download of the metrics may take a while.