Fig. 2.
Download original image
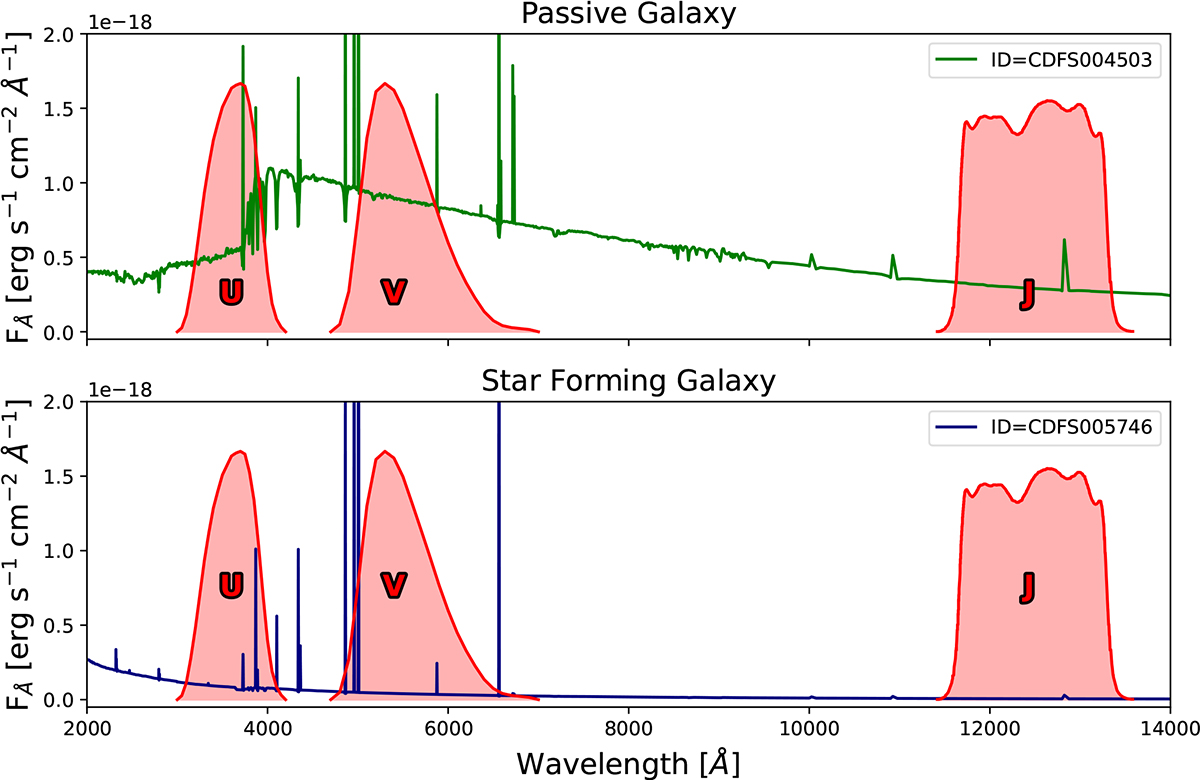
Comparison of SEDs computed by BEAGLE for two galaxy types. The upper panel displays the SED of a passive galaxy (green line), whereas the lower panel shows the SED of a star-forming galaxy (navy line). The U (3584 Å), V (5477 Å), and J (12 474 Å) filters, utilised for calculating photometric magnitudes, are marked on each graph to highlight the spectral regions where these galaxies exhibit significant differences in the rest-frame.
Current usage metrics show cumulative count of Article Views (full-text article views including HTML views, PDF and ePub downloads, according to the available data) and Abstracts Views on Vision4Press platform.
Data correspond to usage on the plateform after 2015. The current usage metrics is available 48-96 hours after online publication and is updated daily on week days.
Initial download of the metrics may take a while.