Open Access
Fig. 1.
Download original image
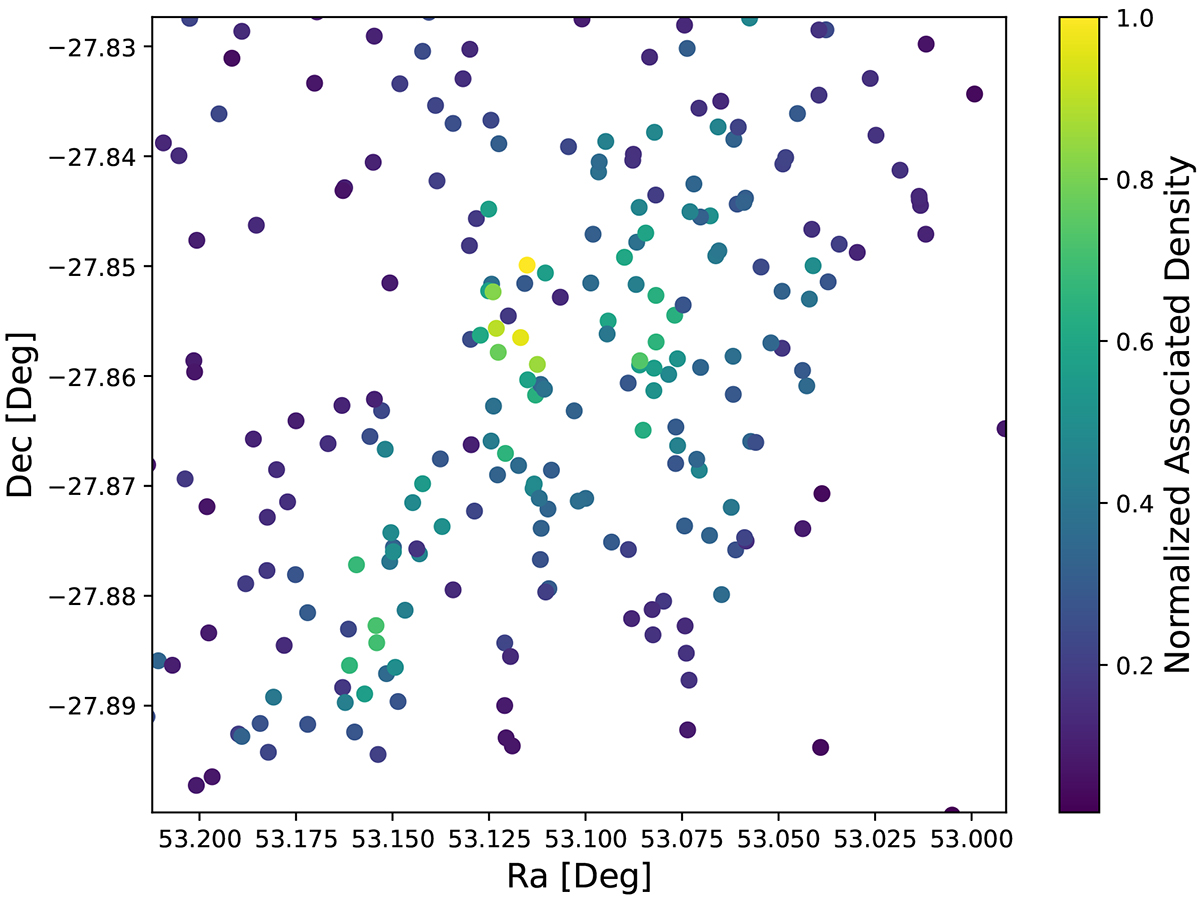
Spatial distribution and associated density of the galaxies associated with the z355 overdensity (see Table 1) and the corresponding field galaxies. The X-axis represents the RA and the Y-axis the Dec in degrees. Colours indicate the associated density, normalized with respect to the highest density peak observed in z355.
Current usage metrics show cumulative count of Article Views (full-text article views including HTML views, PDF and ePub downloads, according to the available data) and Abstracts Views on Vision4Press platform.
Data correspond to usage on the plateform after 2015. The current usage metrics is available 48-96 hours after online publication and is updated daily on week days.
Initial download of the metrics may take a while.