Fig. 3
Download original image
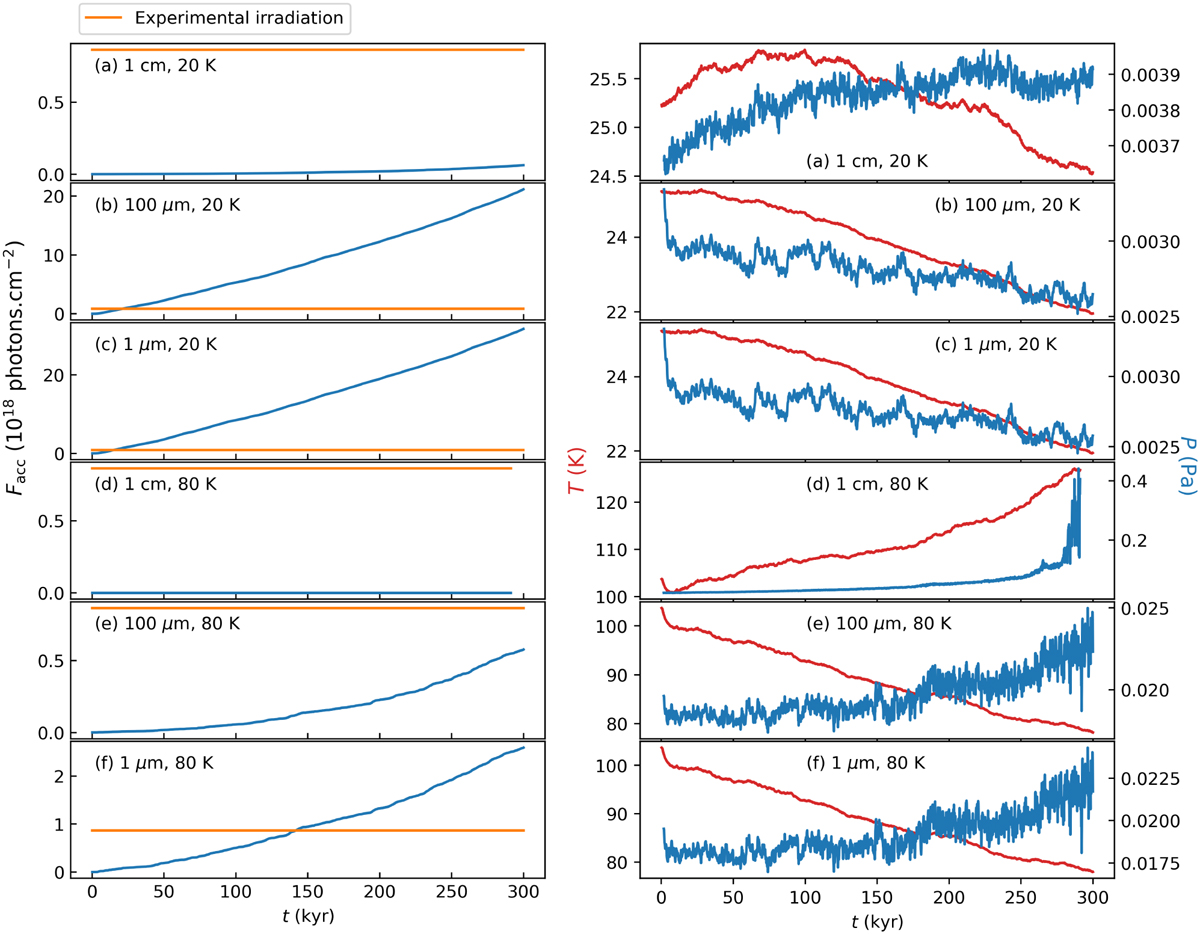
Averaged accumulated irradiation, temperature, and pressure for particles sized 1 cm, 100 µm, and 1 µm, released at disk temperatures of 20 K (panels a, b, and c) and 80 K (panels d, e, and f). Left: averaged accumulated irradiation of the particles over time (blue line) compared to the maximum irradiation accumulated by methanol ice during the experiments (orange line). Right: averaged temperature (red line) and averaged pressure (blue line) experienced by the particles over time.
Current usage metrics show cumulative count of Article Views (full-text article views including HTML views, PDF and ePub downloads, according to the available data) and Abstracts Views on Vision4Press platform.
Data correspond to usage on the plateform after 2015. The current usage metrics is available 48-96 hours after online publication and is updated daily on week days.
Initial download of the metrics may take a while.