Fig. 2
Download original image
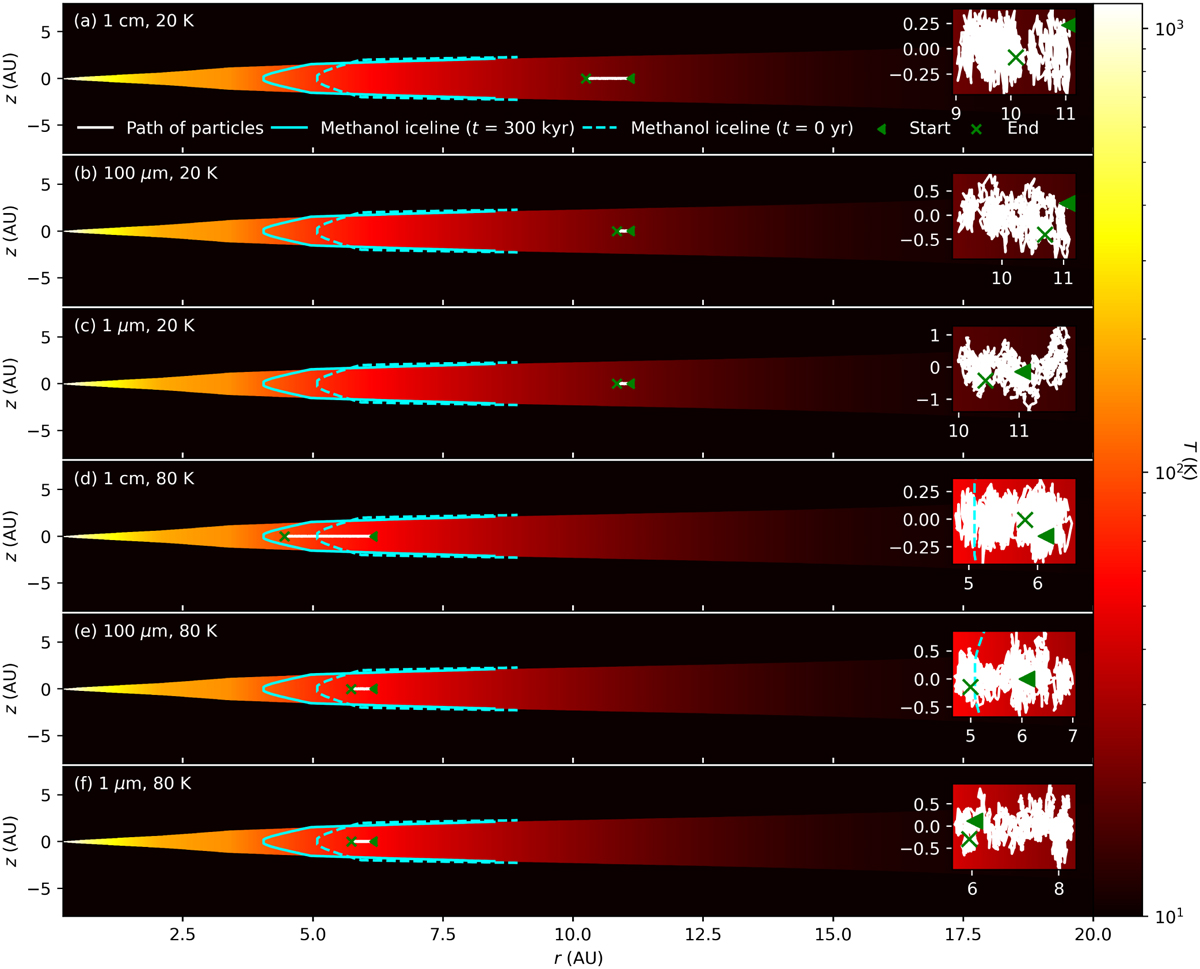
Two-dimensional temperature map of the disk after 300 kyr of evolution, showing the methanol iceline at t = 0 (dashed blue line) and at t = 300 kyr (solid blue line). The white curve represents the average trajectory of 500 simulated particles. To provide a clearer illustration of individual particle behavior, the insets on the right display the trajectory of a single particle within the disk. The panels illustrate the trajectories of particles with sizes of 1 cm, 100 µm, and 1 µm, released at disk temperatures of 20 K (panels a, b, and c) and 80 K (panels d, e, and f). Initial and final positions are marked by a green triangle and a green cross, respectively.
Current usage metrics show cumulative count of Article Views (full-text article views including HTML views, PDF and ePub downloads, according to the available data) and Abstracts Views on Vision4Press platform.
Data correspond to usage on the plateform after 2015. The current usage metrics is available 48-96 hours after online publication and is updated daily on week days.
Initial download of the metrics may take a while.