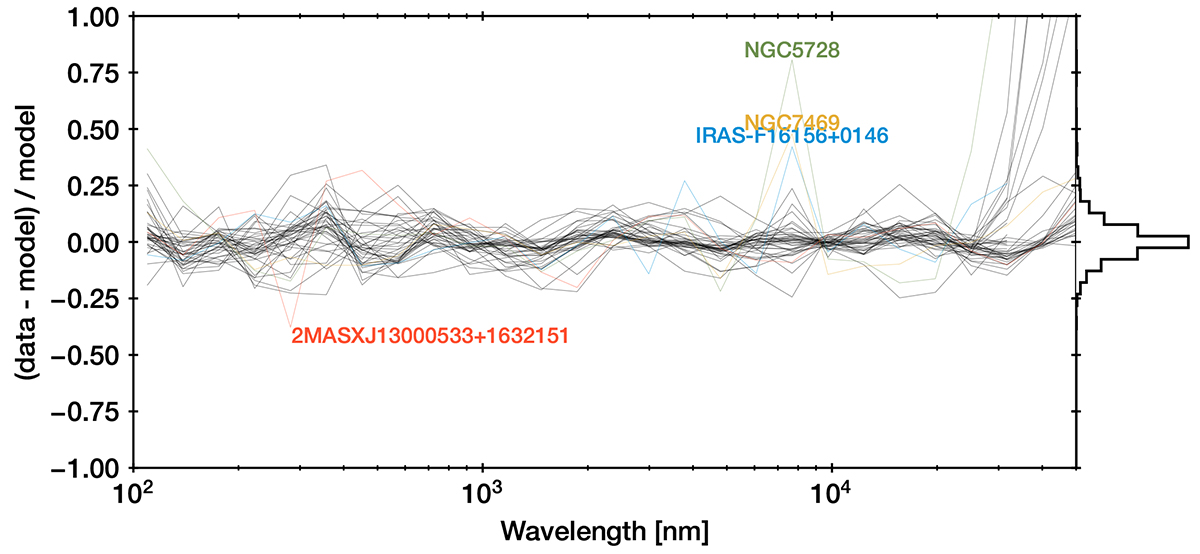
Fig. 8.
Download original image
Relative residuals of the fits of Fig. 7 are shown as curves. Four individual cases with the largest deviations are highlighted in colours and labelled. The distribution of residuals is presented on the right-hand side as a histogram. The vast majority of residuals (96.6%) are concentrated to smaller than 20 per cent deviations.
Current usage metrics show cumulative count of Article Views (full-text article views including HTML views, PDF and ePub downloads, according to the available data) and Abstracts Views on Vision4Press platform.
Data correspond to usage on the plateform after 2015. The current usage metrics is available 48-96 hours after online publication and is updated daily on week days.
Initial download of the metrics may take a while.