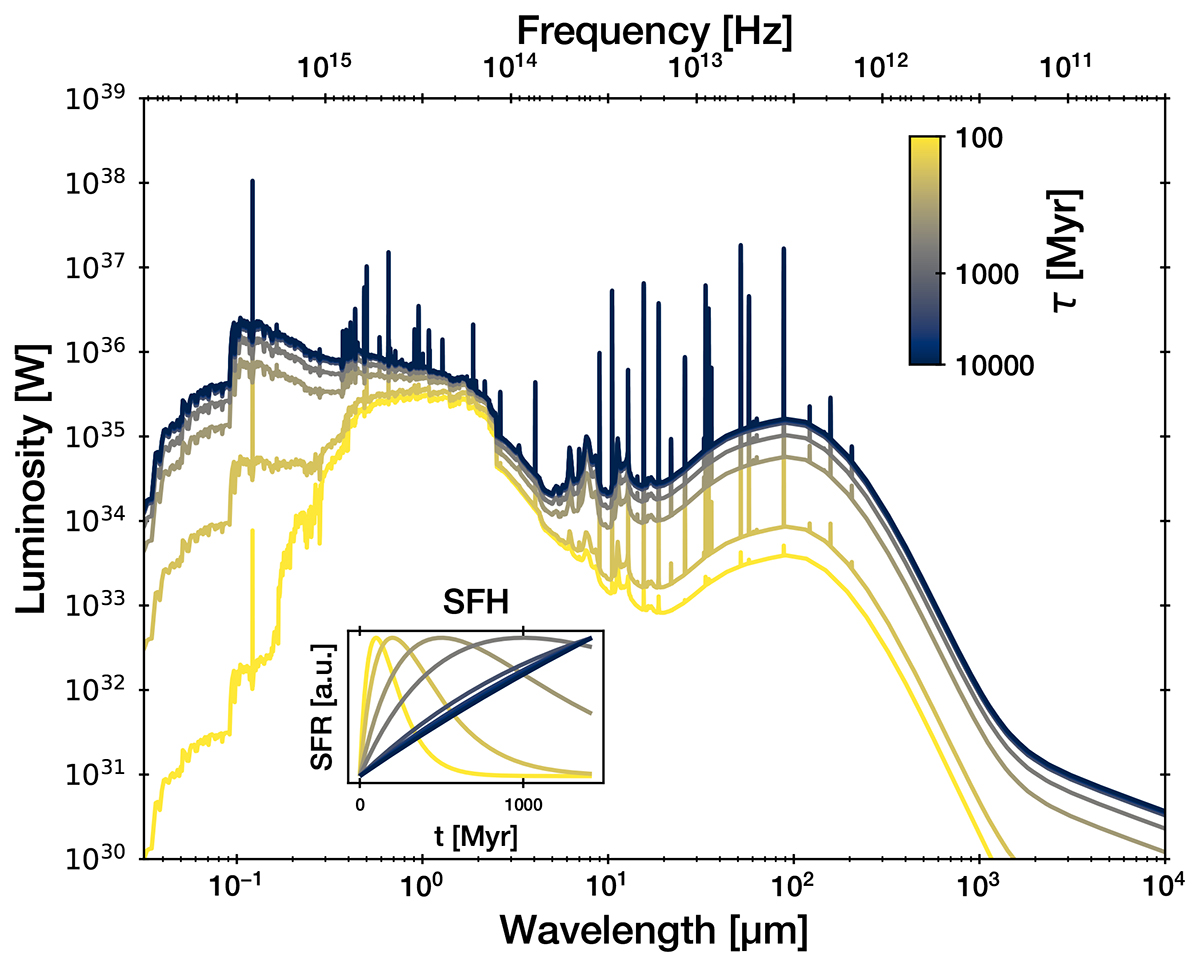
Fig. 4.
Download original image
Example galaxy SEDs of stellar populations with different star formation histories. The star formation rate (see inset) rises linearly towards the present (right), with an exponential cutoff timescale τ. At low τ, the yellow SFR curve truncates quickly, indicating it is dominated by old stars. The corresponding yellow SED in the main panel peaks between 0.3 − 3 μm. The blue curve in the inset corresponds to continuously rising star formation. The corresponding blue SED in the main panel is dominated by luminous young stars, nebular emission lines and infrared dust emission. Minimal attenuation, E(B − V)=0.01, is applied.
Current usage metrics show cumulative count of Article Views (full-text article views including HTML views, PDF and ePub downloads, according to the available data) and Abstracts Views on Vision4Press platform.
Data correspond to usage on the plateform after 2015. The current usage metrics is available 48-96 hours after online publication and is updated daily on week days.
Initial download of the metrics may take a while.