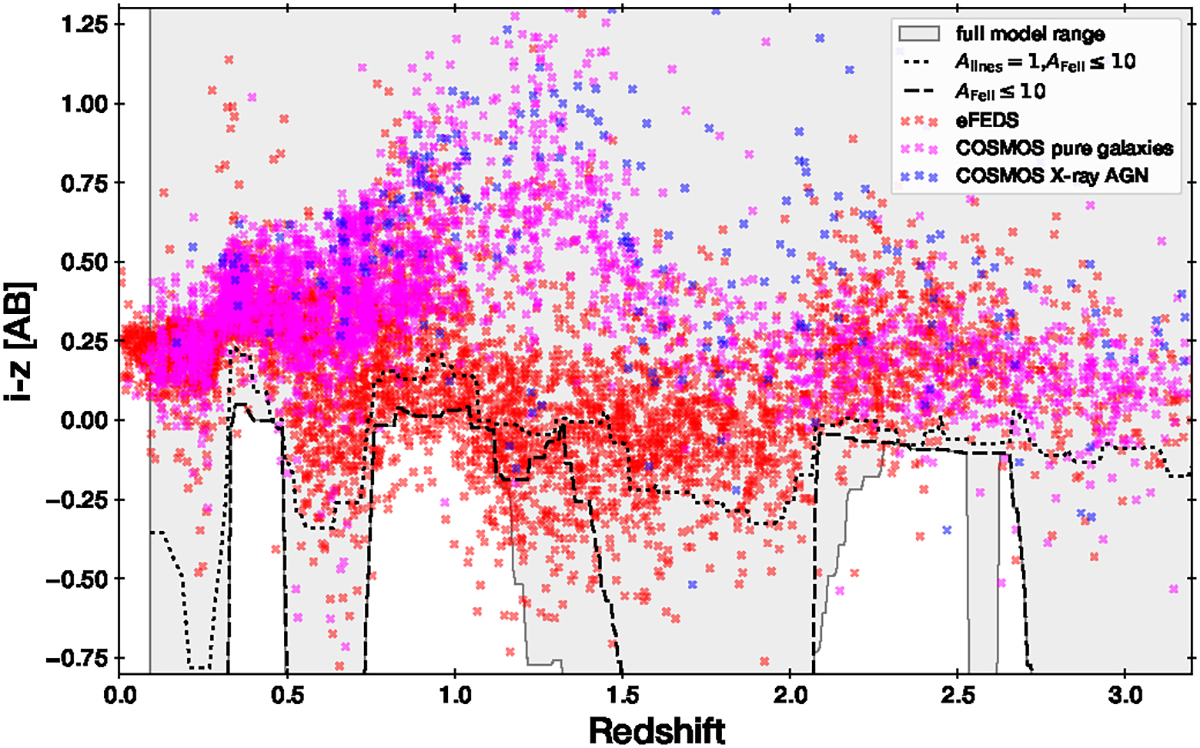
Fig. E.2.
Download original image
i-z colour evolution. The colour range evolution of the model is tested against observations (coloured dots). The model range is shown in grey, for three configurations: the dotted curve is a fiducial model with fixed FeII template and emission line strength. There is good overlap, except near z=0.6, z=1.2 and z=1.5 at negative i-z colours. Increasing the emission line strength range creates an overlap at z=0.6 and z=1.5 (dashed curve). Additionally increasing the FeII template strength range (grey curve, full model range) also produces a good overlap at z=1.2. However, at z=0.8, some observed eFEDS colours are lower than the model.
Current usage metrics show cumulative count of Article Views (full-text article views including HTML views, PDF and ePub downloads, according to the available data) and Abstracts Views on Vision4Press platform.
Data correspond to usage on the plateform after 2015. The current usage metrics is available 48-96 hours after online publication and is updated daily on week days.
Initial download of the metrics may take a while.