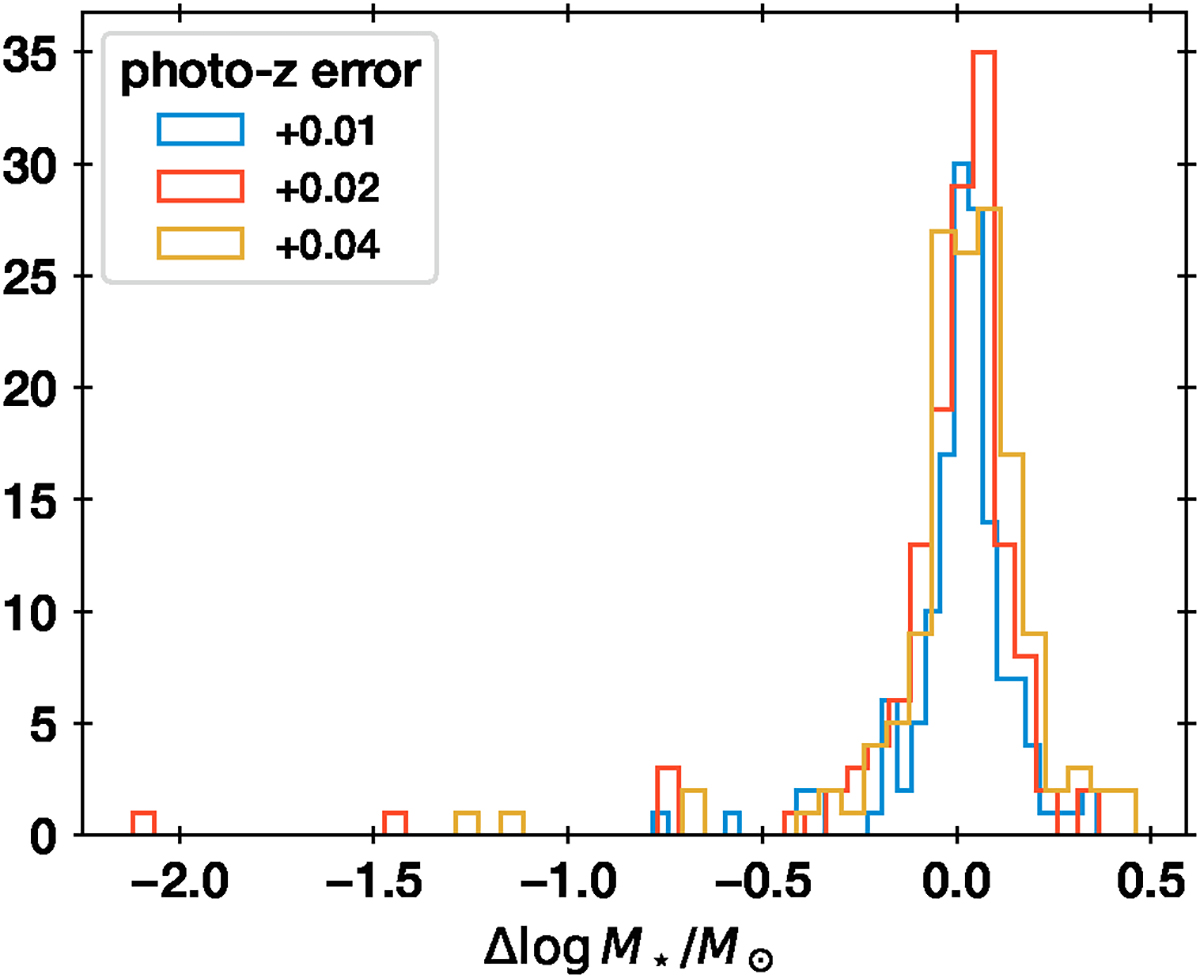
Fig. C.1.
Download original image
Change in the stellar mass estimate when the redshift is inaccurate. The x-axis shows the change in stellar mass from a reference run at the spectroscopic redshift, and another run assuming z + Δ × (1 + z) as the redshift, with Δ values of 0.01 (blue), 0.02 (red) and 0.04 (yellow). The red and yellow histograms are similar, with a tail to the left. The blue histogram is narrower and lacks the long tails present in the other two histograms.
Current usage metrics show cumulative count of Article Views (full-text article views including HTML views, PDF and ePub downloads, according to the available data) and Abstracts Views on Vision4Press platform.
Data correspond to usage on the plateform after 2015. The current usage metrics is available 48-96 hours after online publication and is updated daily on week days.
Initial download of the metrics may take a while.