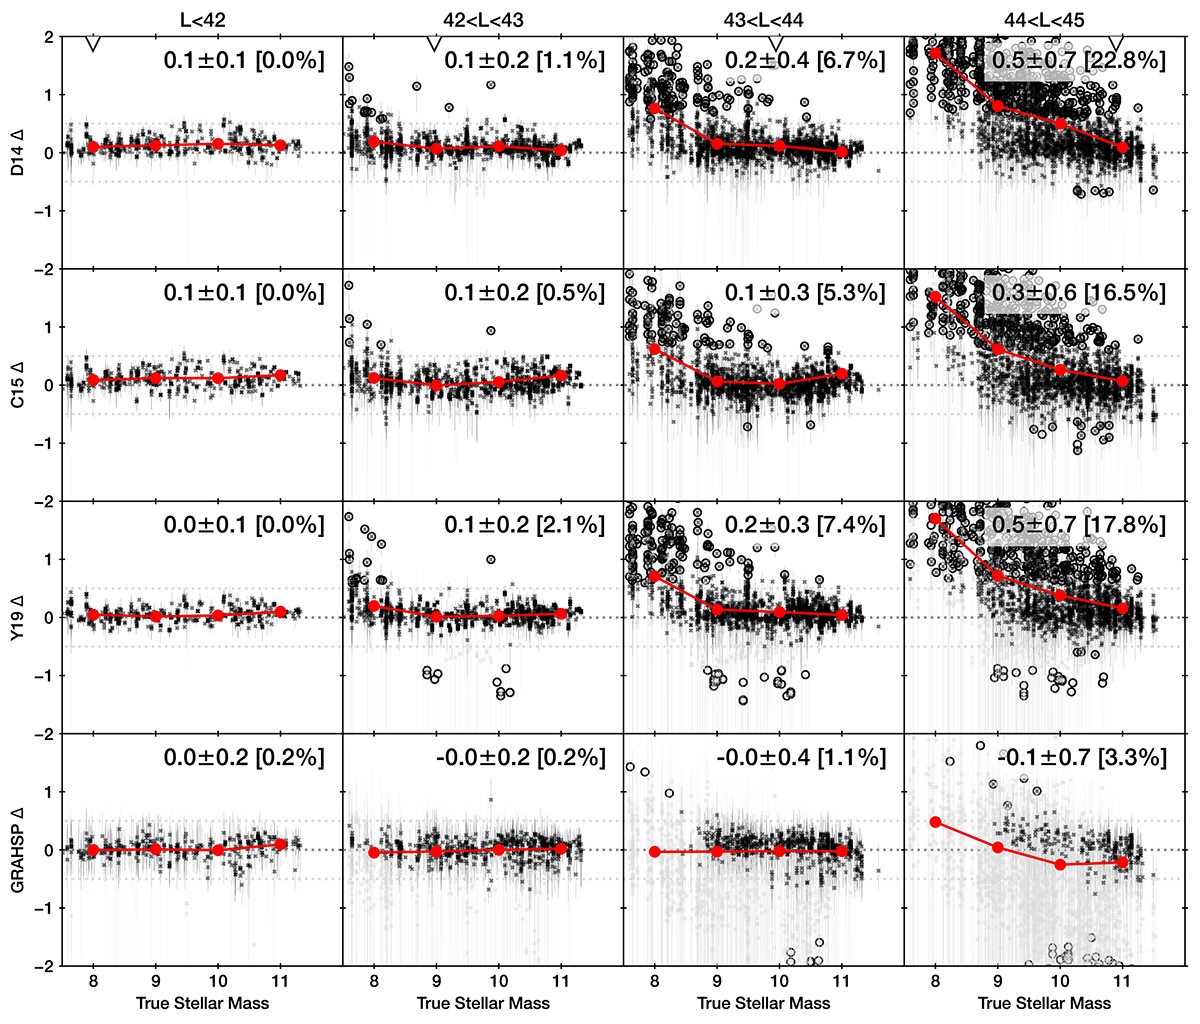
Fig. 21.
Download original image
Retrieval of stellar masses on the Chimera benchmark data set. The y-axis always shows the ratio of the estimated stellar mass to the true stellar mass (x-axis), in log units of M⊙. The first three rows are AGN models in CIGALE, the last row is GRAHSP. The sample is split into four bins (panel columns) of true AGN bolometric luminosity (in erg/s, log). Results with large error bars (> 1 dex) are in grey. If the measured stellar mass deviates from the expectation (dotted grey horizontal lines) by more than 0.5 dex, it is considered an outlier and indicated with a circle. In each bin, the mean and standard deviation are quoted, together with the fraction of outliers in brackets. CIGALE models show a 0.2–0.5 dex bias at L > 43. For GRAHSP, the bias is below 0.1 dex. The GRAHSP fraction of outliers is also lower. The downward-pointing triangles at the very top of the figure indicate where the AGN and galaxy luminosities are approximately equal (λ = 1 in Eq. (6)). The CIGALE models start to deviate to the left of these markers, corresponding to λ > 1.
Current usage metrics show cumulative count of Article Views (full-text article views including HTML views, PDF and ePub downloads, according to the available data) and Abstracts Views on Vision4Press platform.
Data correspond to usage on the plateform after 2015. The current usage metrics is available 48-96 hours after online publication and is updated daily on week days.
Initial download of the metrics may take a while.