Open Access
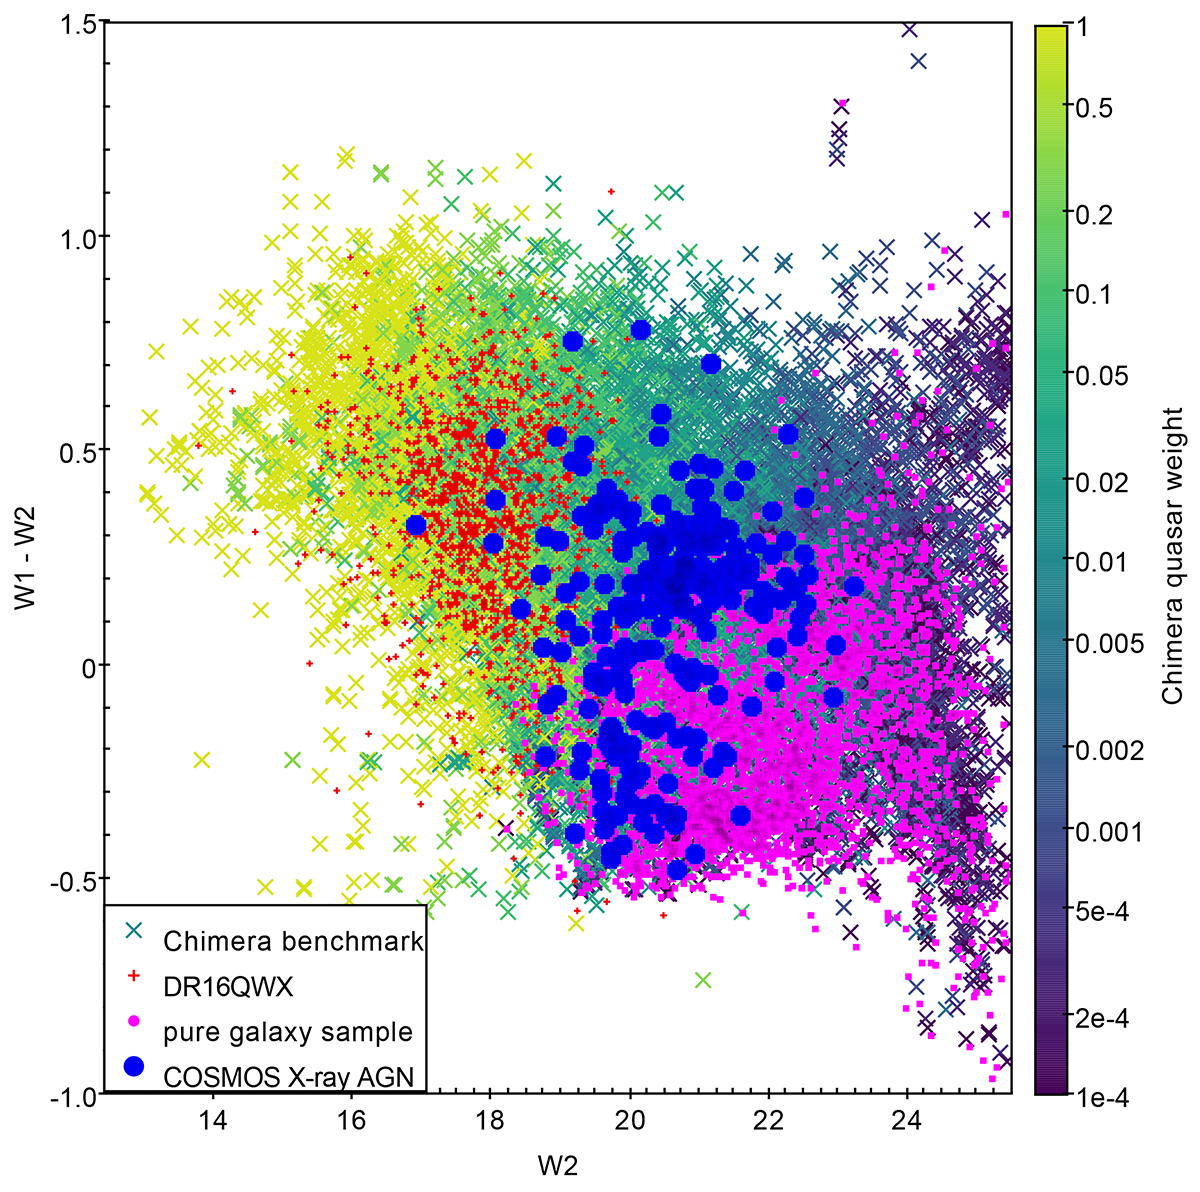
Fig. 11.
Download original image
WISE diagnostic plot for the same samples as shown in Fig. 10. Sources dominated by galaxy light tend to lie towards the bottom-right. With increasing AGN luminosities (colour bar), sources move to the upper-left. Magnitudes are in AB.
Current usage metrics show cumulative count of Article Views (full-text article views including HTML views, PDF and ePub downloads, according to the available data) and Abstracts Views on Vision4Press platform.
Data correspond to usage on the plateform after 2015. The current usage metrics is available 48-96 hours after online publication and is updated daily on week days.
Initial download of the metrics may take a while.