Open Access
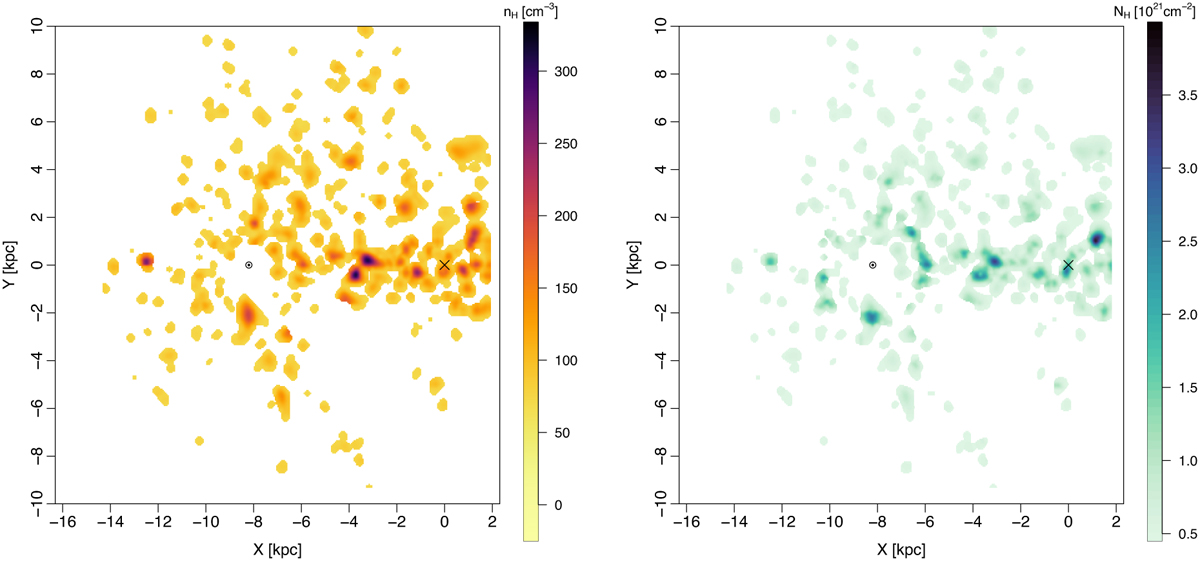
Fig. 9
Download original image
Comparison of volume density and column density. Left panel: volume densities of clouds from our 3D map (same as Fig. 3, right). Right panel: column densities of left side clouds integrated over the Z access.
Current usage metrics show cumulative count of Article Views (full-text article views including HTML views, PDF and ePub downloads, according to the available data) and Abstracts Views on Vision4Press platform.
Data correspond to usage on the plateform after 2015. The current usage metrics is available 48-96 hours after online publication and is updated daily on week days.
Initial download of the metrics may take a while.