Fig. 7
Download original image
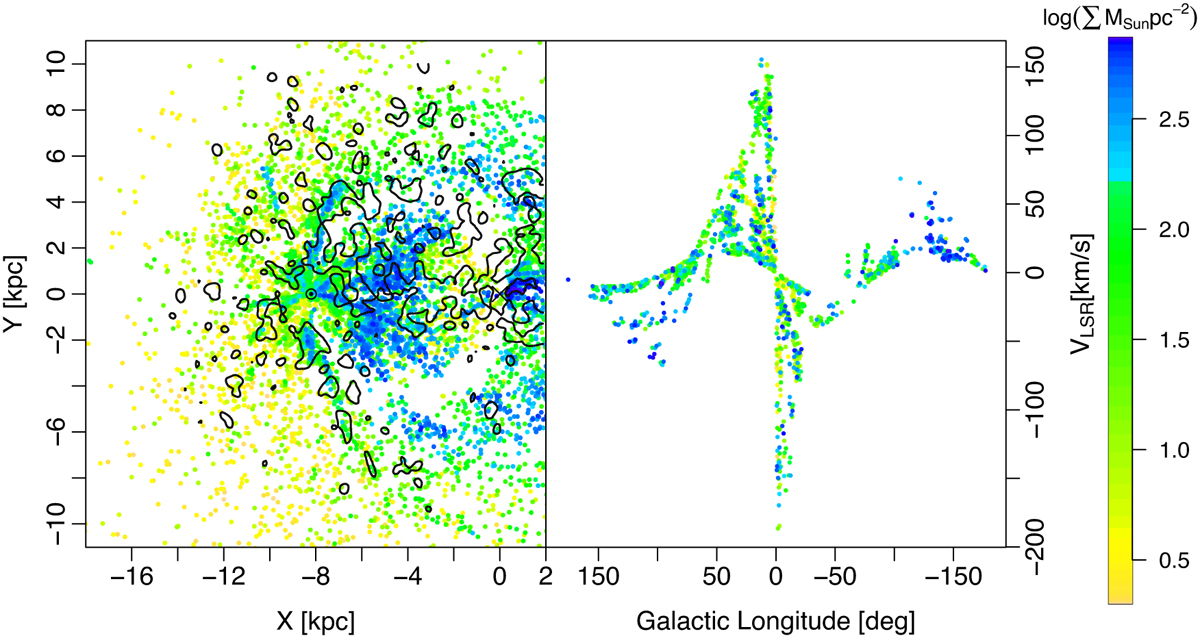
Comparison between our clouds and molecular clouds observed in CO. Left panel: 3D distribution of molecular clouds observed in CO from Miville-Deschênes et al. (2017), with our extracted clouds over-plotted as contours. Right panel: longitude-velocity plot of molecular clouds from the left, situated underneath our cloud contours. The colour shows the surface density of clouds derived in Miville-Deschênes et al. (2017).
Current usage metrics show cumulative count of Article Views (full-text article views including HTML views, PDF and ePub downloads, according to the available data) and Abstracts Views on Vision4Press platform.
Data correspond to usage on the plateform after 2015. The current usage metrics is available 48-96 hours after online publication and is updated daily on week days.
Initial download of the metrics may take a while.