Fig. 5
Download original image
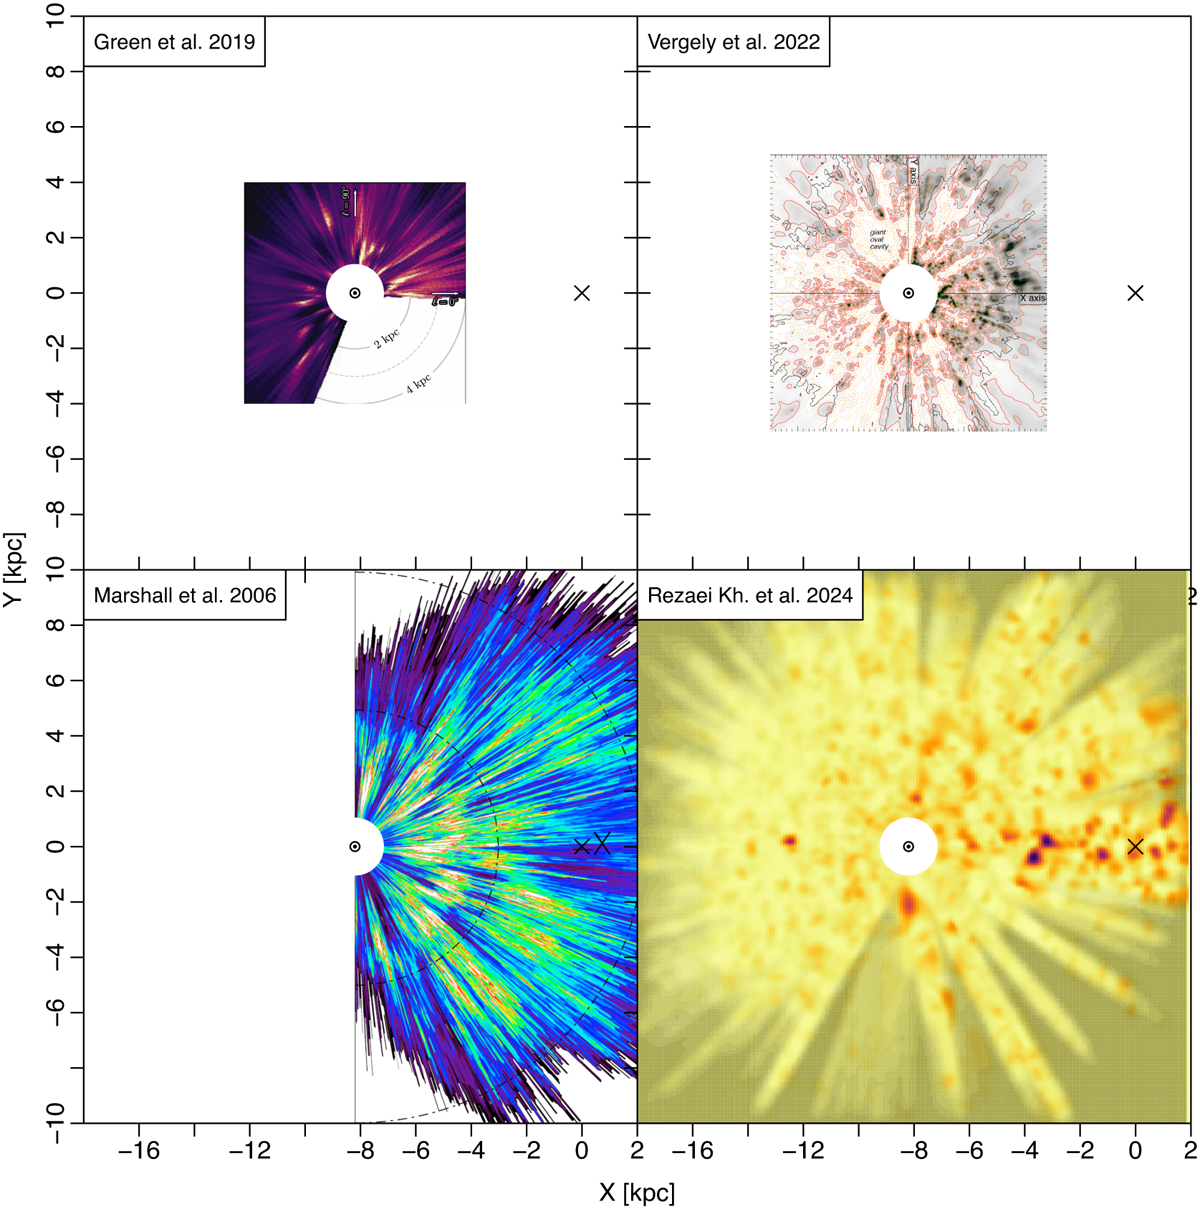
Comparison of locations of high-density dust in 3D dust maps of Galactic plane. Grids are drawn for easier comparisons between maps. The lower right panel shows our 3D map where dashed lines represent identified large cavities. Similar cavities are seen in the upper right panel representing the work of Vergely et al. (2022). While matching cavities seem to be present at similar locations in the other two panels, (Green et al. 2019; Marshall et al. 2006), due to substantial artefacts a direct comparison appears difficult. Apart from our map, only the work of Marshall et al. (2006) expands beyond the Galactic centre; despite the elongated artefacts, multiple over-densities in the first quadrant and towards the Galactic centre are evident on both maps. The range and the width of the maps along the Z direction vary; Vergely et al. (2022) covered from Z=−400 pc to Z=400 pc and provides extinction densities ranging between 0 and 5 × 10⁻³ mag/pc, while Green et al. (2019) covered Z=−300 pc to Z=300 pc and provides differential extinction ranging from 0 to 0.5 mag/kpc. Marshall et al. (2006) covered |b| ≤ 0.25 and represents average extinction density of 0–0.4 kpc−1.
Current usage metrics show cumulative count of Article Views (full-text article views including HTML views, PDF and ePub downloads, according to the available data) and Abstracts Views on Vision4Press platform.
Data correspond to usage on the plateform after 2015. The current usage metrics is available 48-96 hours after online publication and is updated daily on week days.
Initial download of the metrics may take a while.