Fig. 4
Download original image
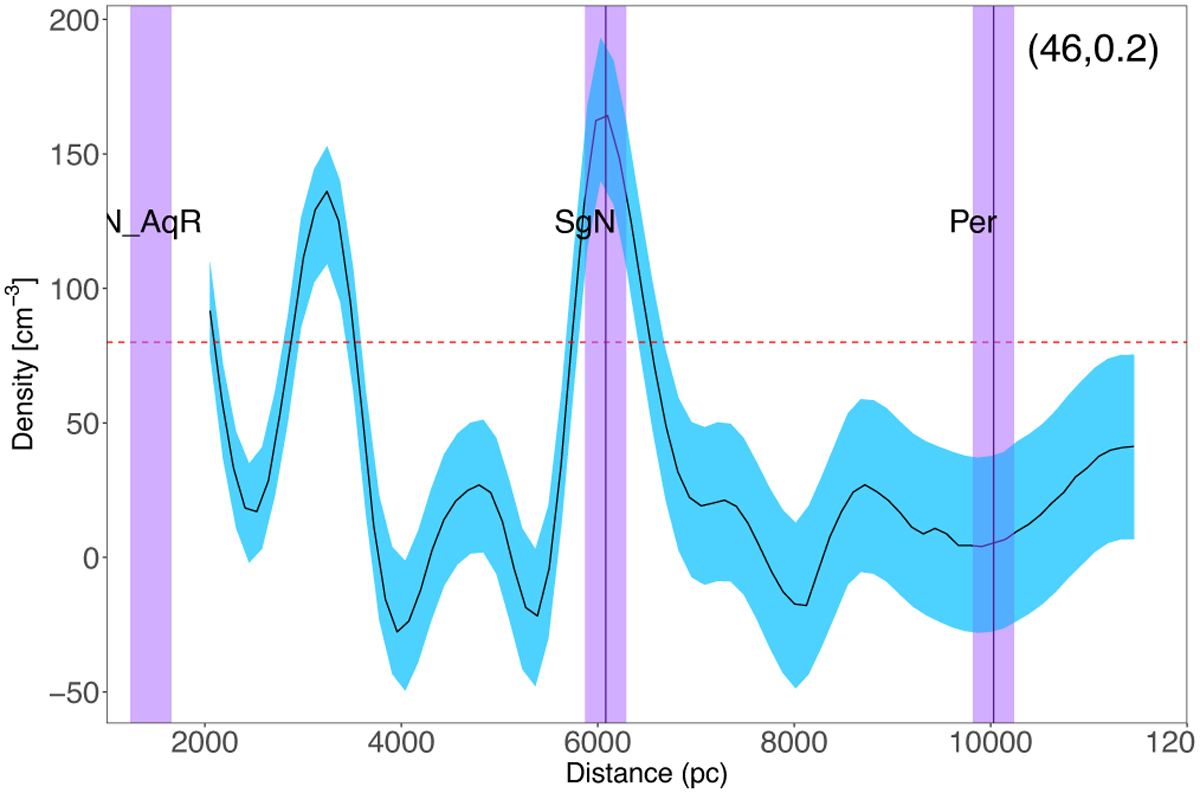
Example of how clouds in Table A.1 are assigned to known structures and spiral arms. The black line with the blue shaded uncertainties are our density predictions as a function of distance for a given LOS, and the purple vertical lines are all probable distance estimates from the BESSEL survey (Reid et al. 2016) for the same LOS with velocities observed in Dame et al. (1986) (e.g. Aquila rift, Sagittarius Near, and Perseus here). The dashed red line indicates our threshold for selecting statistically significant clouds. If there is a match, such as the near Sagittarius Arm in the middle, we assign the cloud to that particular structure. The LOS’ galactic longitude and latitude are shown in the top right corner.
Current usage metrics show cumulative count of Article Views (full-text article views including HTML views, PDF and ePub downloads, according to the available data) and Abstracts Views on Vision4Press platform.
Data correspond to usage on the plateform after 2015. The current usage metrics is available 48-96 hours after online publication and is updated daily on week days.
Initial download of the metrics may take a while.