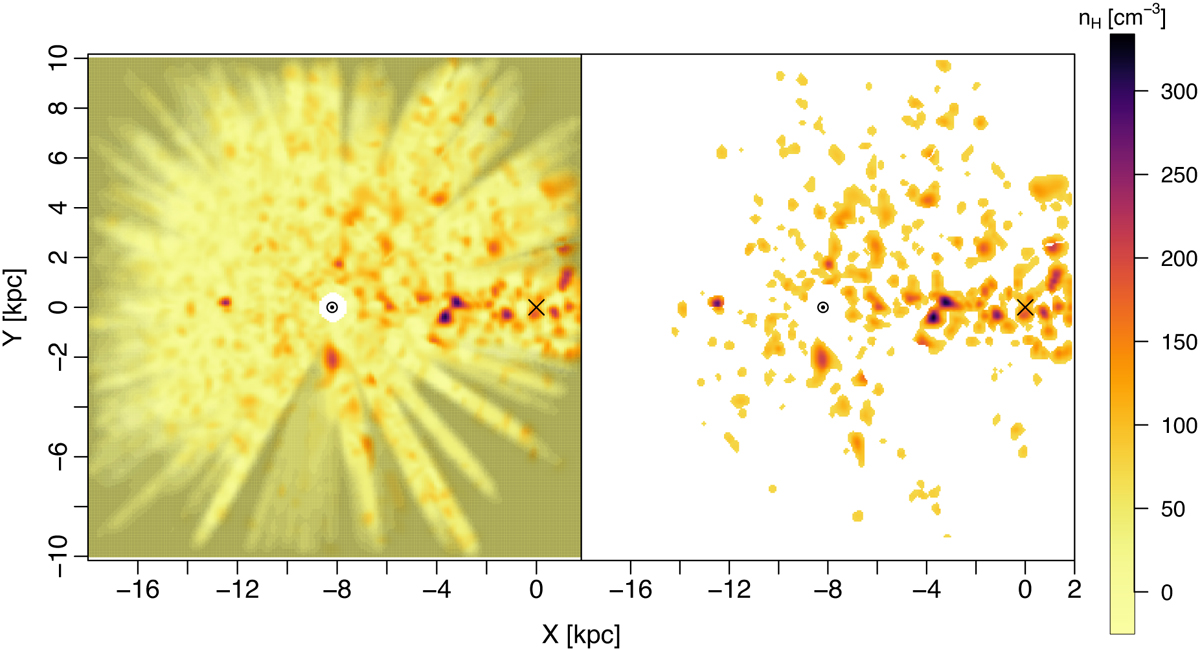
Fig. 3
Download original image
Frontal view of 3D map for all Galactic heights. Left panel: same as bottom right panel of Fig. 2, in addition to having shaded areas illustrating regions of high uncertainty (fractional uncertainties larger than 50%). Right panel: clouds selected from 3D map whose density values lie three standard deviations above the mean of the Gaussian process. This corresponds to densities above 80 cm−3.
Current usage metrics show cumulative count of Article Views (full-text article views including HTML views, PDF and ePub downloads, according to the available data) and Abstracts Views on Vision4Press platform.
Data correspond to usage on the plateform after 2015. The current usage metrics is available 48-96 hours after online publication and is updated daily on week days.
Initial download of the metrics may take a while.