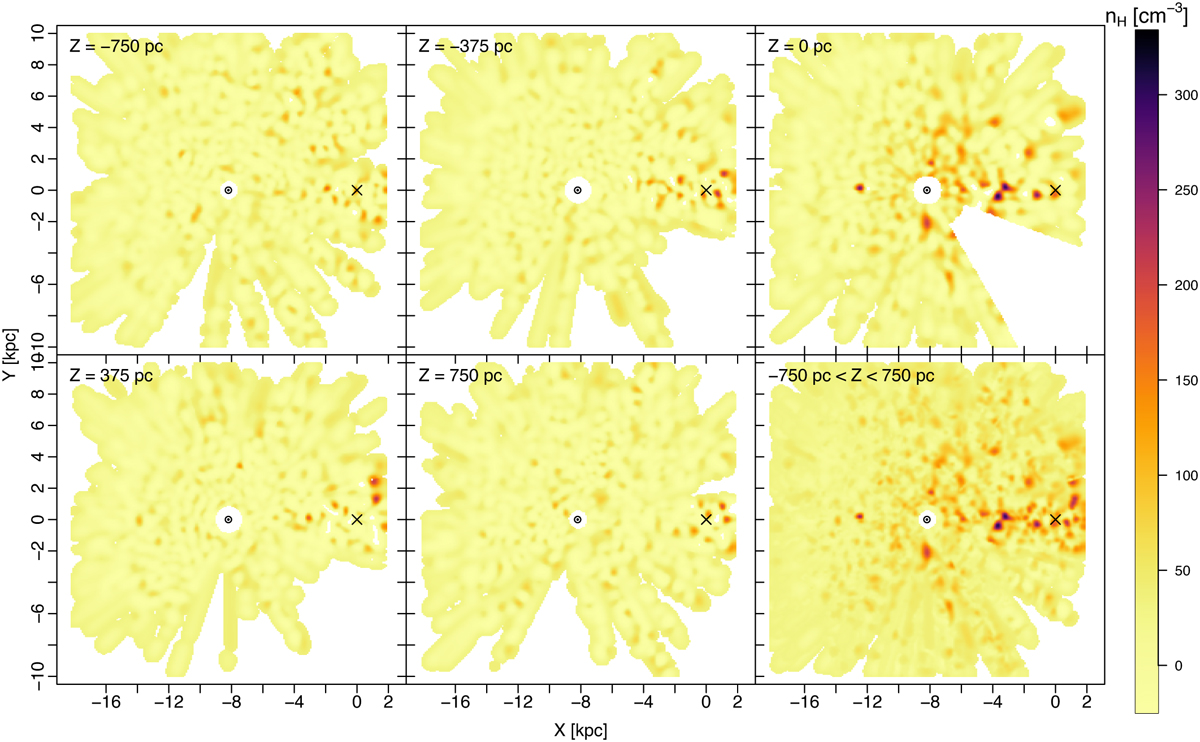
Fig. 2
Download original image
Frontal view of our 3D map of dust in Galactic plane for different Galactic heights. The bottom right panel shows the combined map from -750 pc to 750 pc in the Galactic height. The colour shows the mean of our predicted density (cm−3) for each pixel (100×100 in X − Y plane) in all panels, except for the bottom right where the colour represents the maximum density within the 1.5 kpc height. The Sun is at (−8.2,0,0) and the Galactic centre is marked with an ×, assuming the Sun is 8.2 kpc from the Galactic centre. White regions are areas devoid of input data.
Current usage metrics show cumulative count of Article Views (full-text article views including HTML views, PDF and ePub downloads, according to the available data) and Abstracts Views on Vision4Press platform.
Data correspond to usage on the plateform after 2015. The current usage metrics is available 48-96 hours after online publication and is updated daily on week days.
Initial download of the metrics may take a while.