Open Access
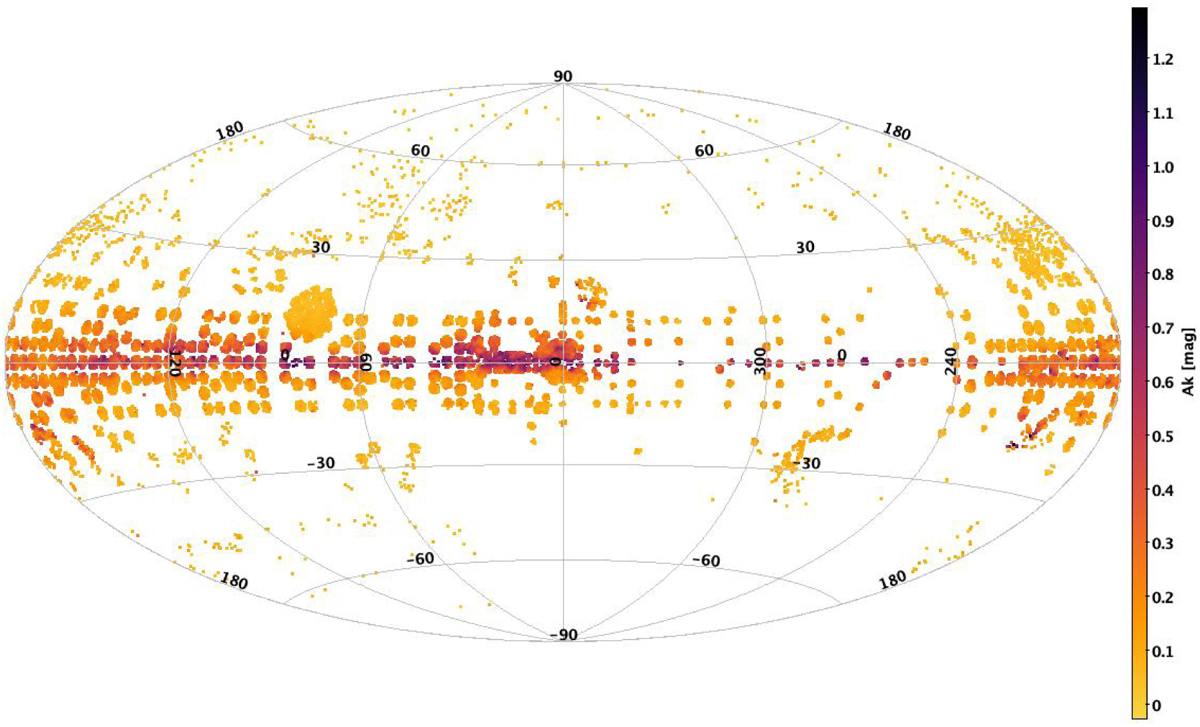
Fig. B.1
Download original image
An aitoff view of the input data representing the pointing pattern of the APOGEE. Most of the data is concentrated in the Galactic Plane, and the Northern Hemisphere with few observations in the Southern Hemisphere as well. colour represents the mean extinction per pixel.
Current usage metrics show cumulative count of Article Views (full-text article views including HTML views, PDF and ePub downloads, according to the available data) and Abstracts Views on Vision4Press platform.
Data correspond to usage on the plateform after 2015. The current usage metrics is available 48-96 hours after online publication and is updated daily on week days.
Initial download of the metrics may take a while.