Fig. 1
Download original image
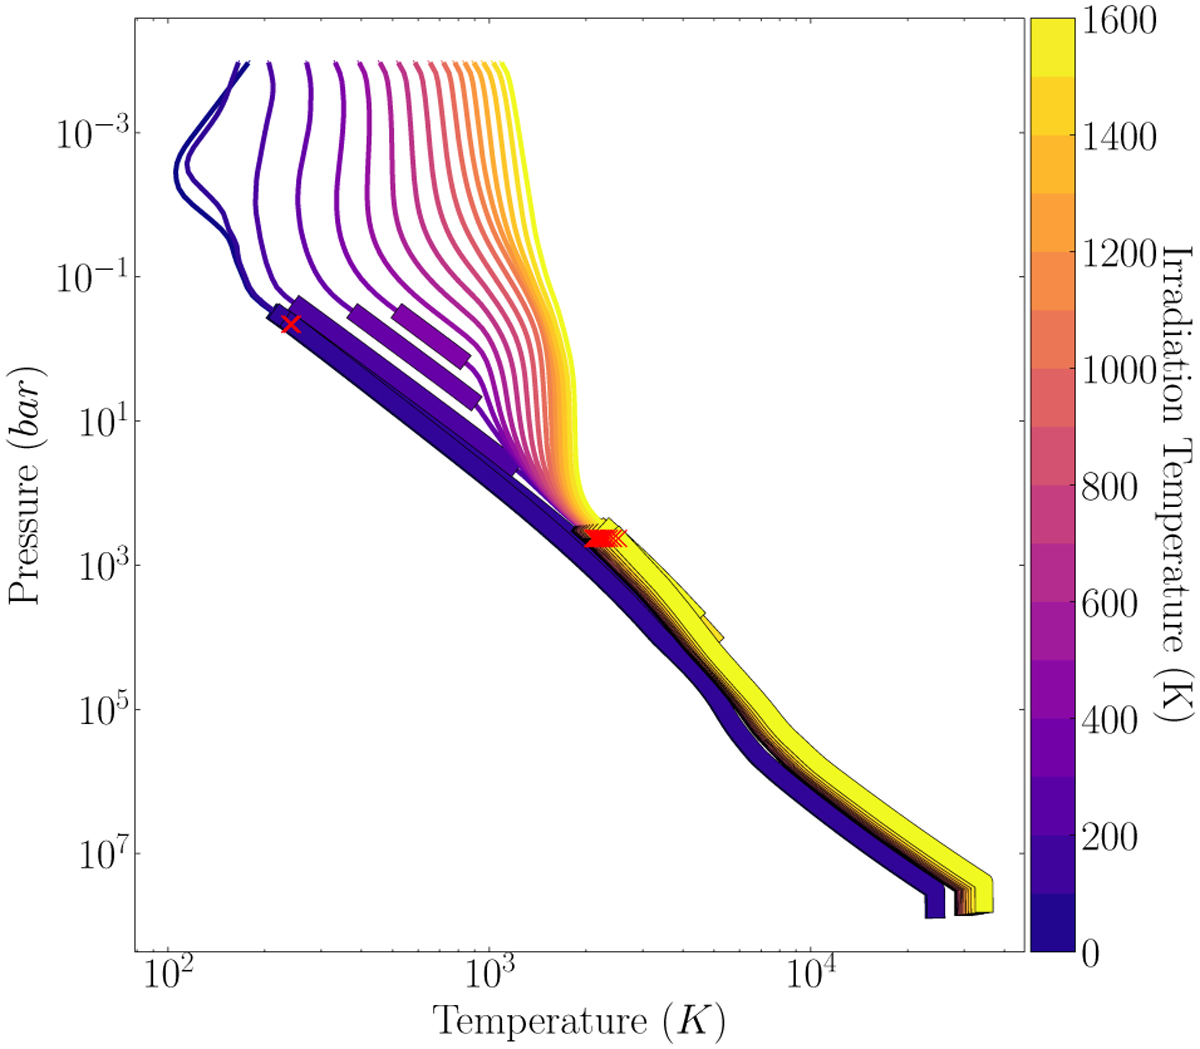
Pressure–temperature profiles for a 1 MJ planet across a range of stellar irradiation values. The red crosses indicate the point at which the interior model and atmosphere model are linked. The thicker zones delimited by black boxes correspond to the onset of convective dynamics in the atmosphere continuing down to the interior.
Current usage metrics show cumulative count of Article Views (full-text article views including HTML views, PDF and ePub downloads, according to the available data) and Abstracts Views on Vision4Press platform.
Data correspond to usage on the plateform after 2015. The current usage metrics is available 48-96 hours after online publication and is updated daily on week days.
Initial download of the metrics may take a while.