Open Access
Fig. 9
Download original image
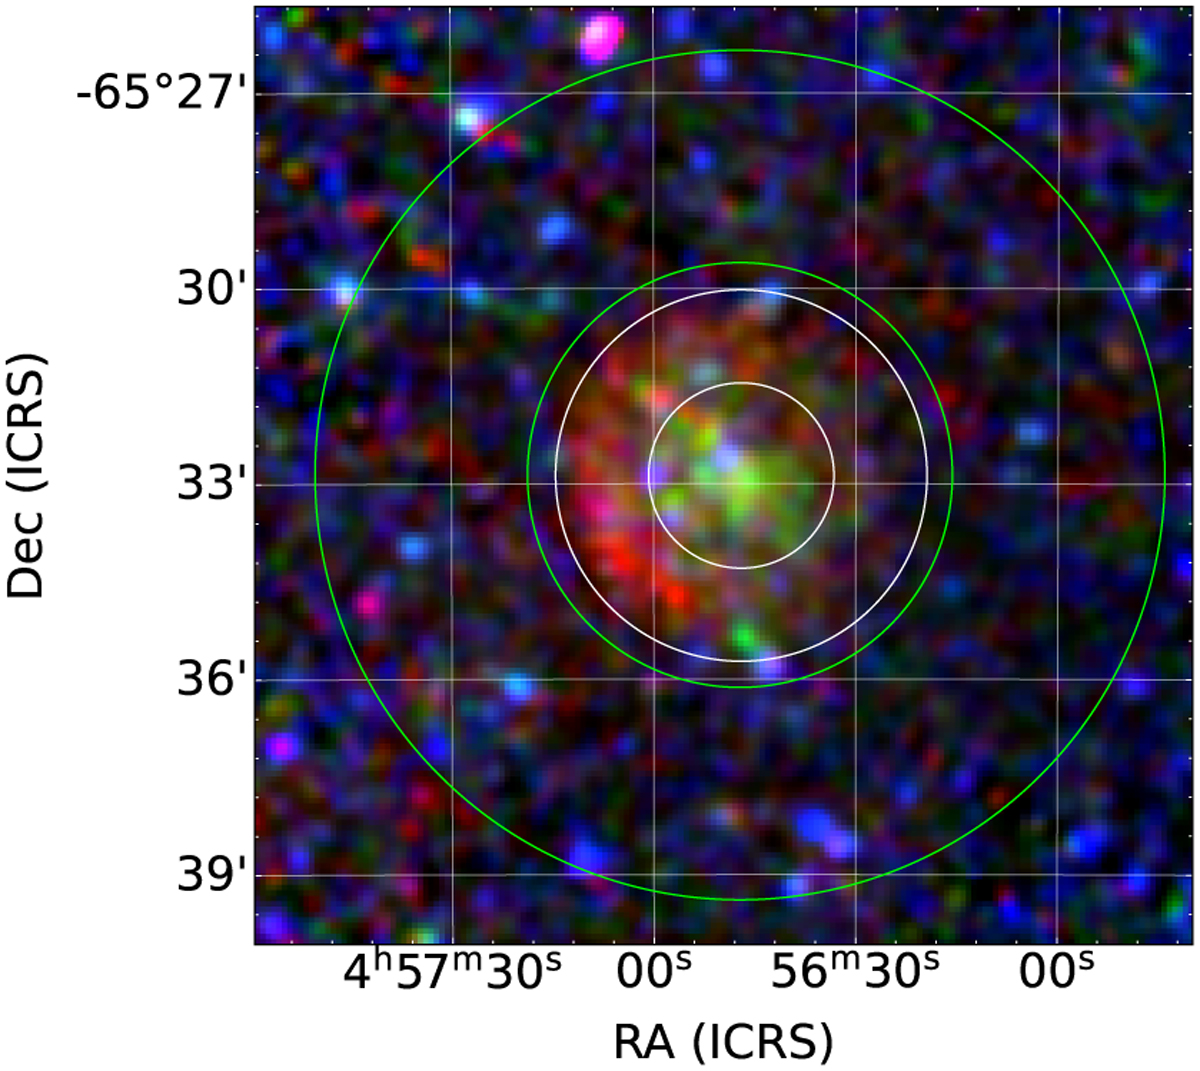
Three-colour image of J0456–6533 with red for 0.3–0.7 keV. green for 0.7–1.1 keV, and blue for 1.1–4.5 keV. The inner white circle and the white annulus around it mark the two source extraction regions. The green annular region around the SNR shows the background extraction region.
Current usage metrics show cumulative count of Article Views (full-text article views including HTML views, PDF and ePub downloads, according to the available data) and Abstracts Views on Vision4Press platform.
Data correspond to usage on the plateform after 2015. The current usage metrics is available 48-96 hours after online publication and is updated daily on week days.
Initial download of the metrics may take a while.