Fig. 6
Download original image
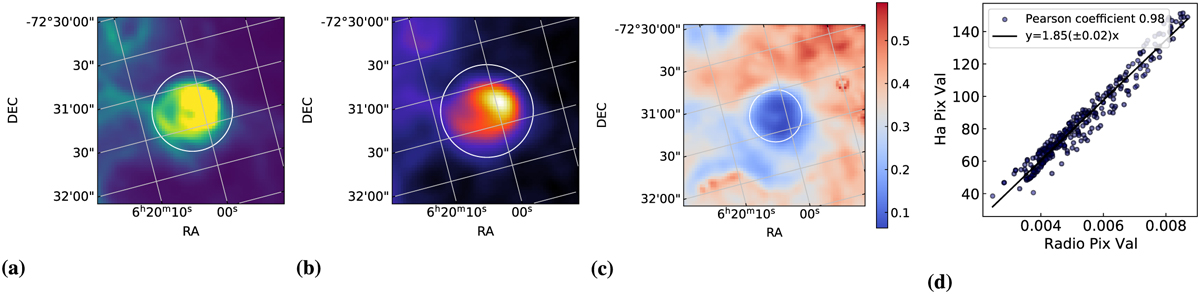
Sub-region of the HII region DEM-L140 chosen to highlight the non-thermal emission in the radio images. In particular Figs. 6a and 6b show the emission of the selected region in Hα and radio respectively. Figure 6c displays the image of the [SII]/Hα ratio. The latter image is used to ensure that the selected region is not affected by any SNR that would increase the [SII]/Hα ratio to values larger than 0.4. In Fig. 6d the linear correlation between the Hα and radio emission in the selected area is reported. The black solid line represents the best linear fit for this correlation.
Current usage metrics show cumulative count of Article Views (full-text article views including HTML views, PDF and ePub downloads, according to the available data) and Abstracts Views on Vision4Press platform.
Data correspond to usage on the plateform after 2015. The current usage metrics is available 48-96 hours after online publication and is updated daily on week days.
Initial download of the metrics may take a while.