Open Access
Fig. 3
Download original image
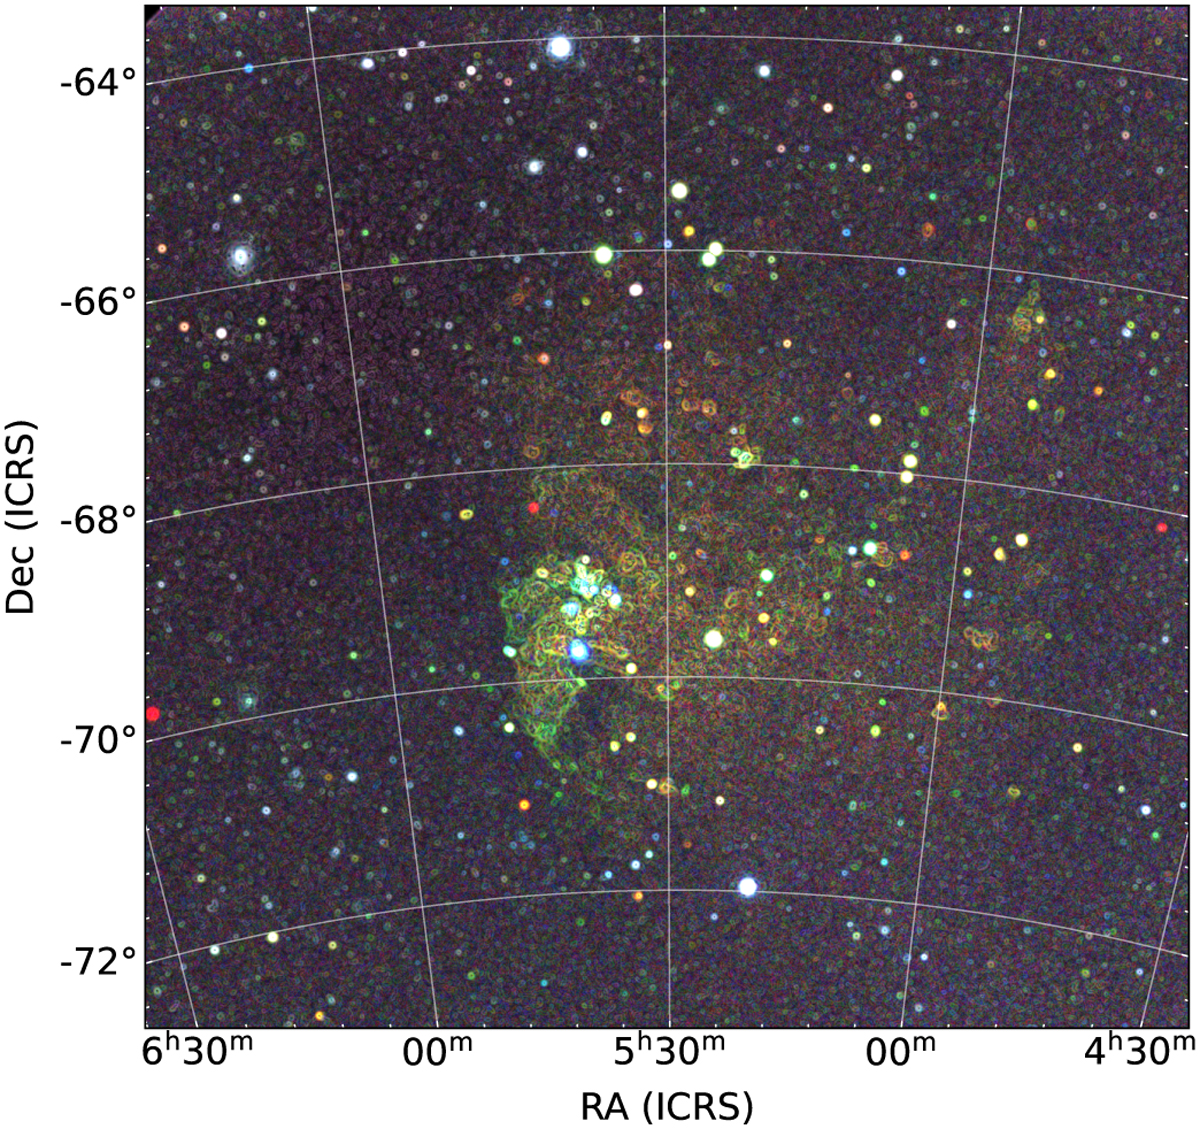
eROSITA three-colour image after point sources were removed and the GGM filter was applied. This GGM-filtered image shows the magnitude of the gradient of the input image. The filter was applied to each energy band separately and the resulting images were combined into a three-colour image.
Current usage metrics show cumulative count of Article Views (full-text article views including HTML views, PDF and ePub downloads, according to the available data) and Abstracts Views on Vision4Press platform.
Data correspond to usage on the plateform after 2015. The current usage metrics is available 48-96 hours after online publication and is updated daily on week days.
Initial download of the metrics may take a while.