Fig. 11
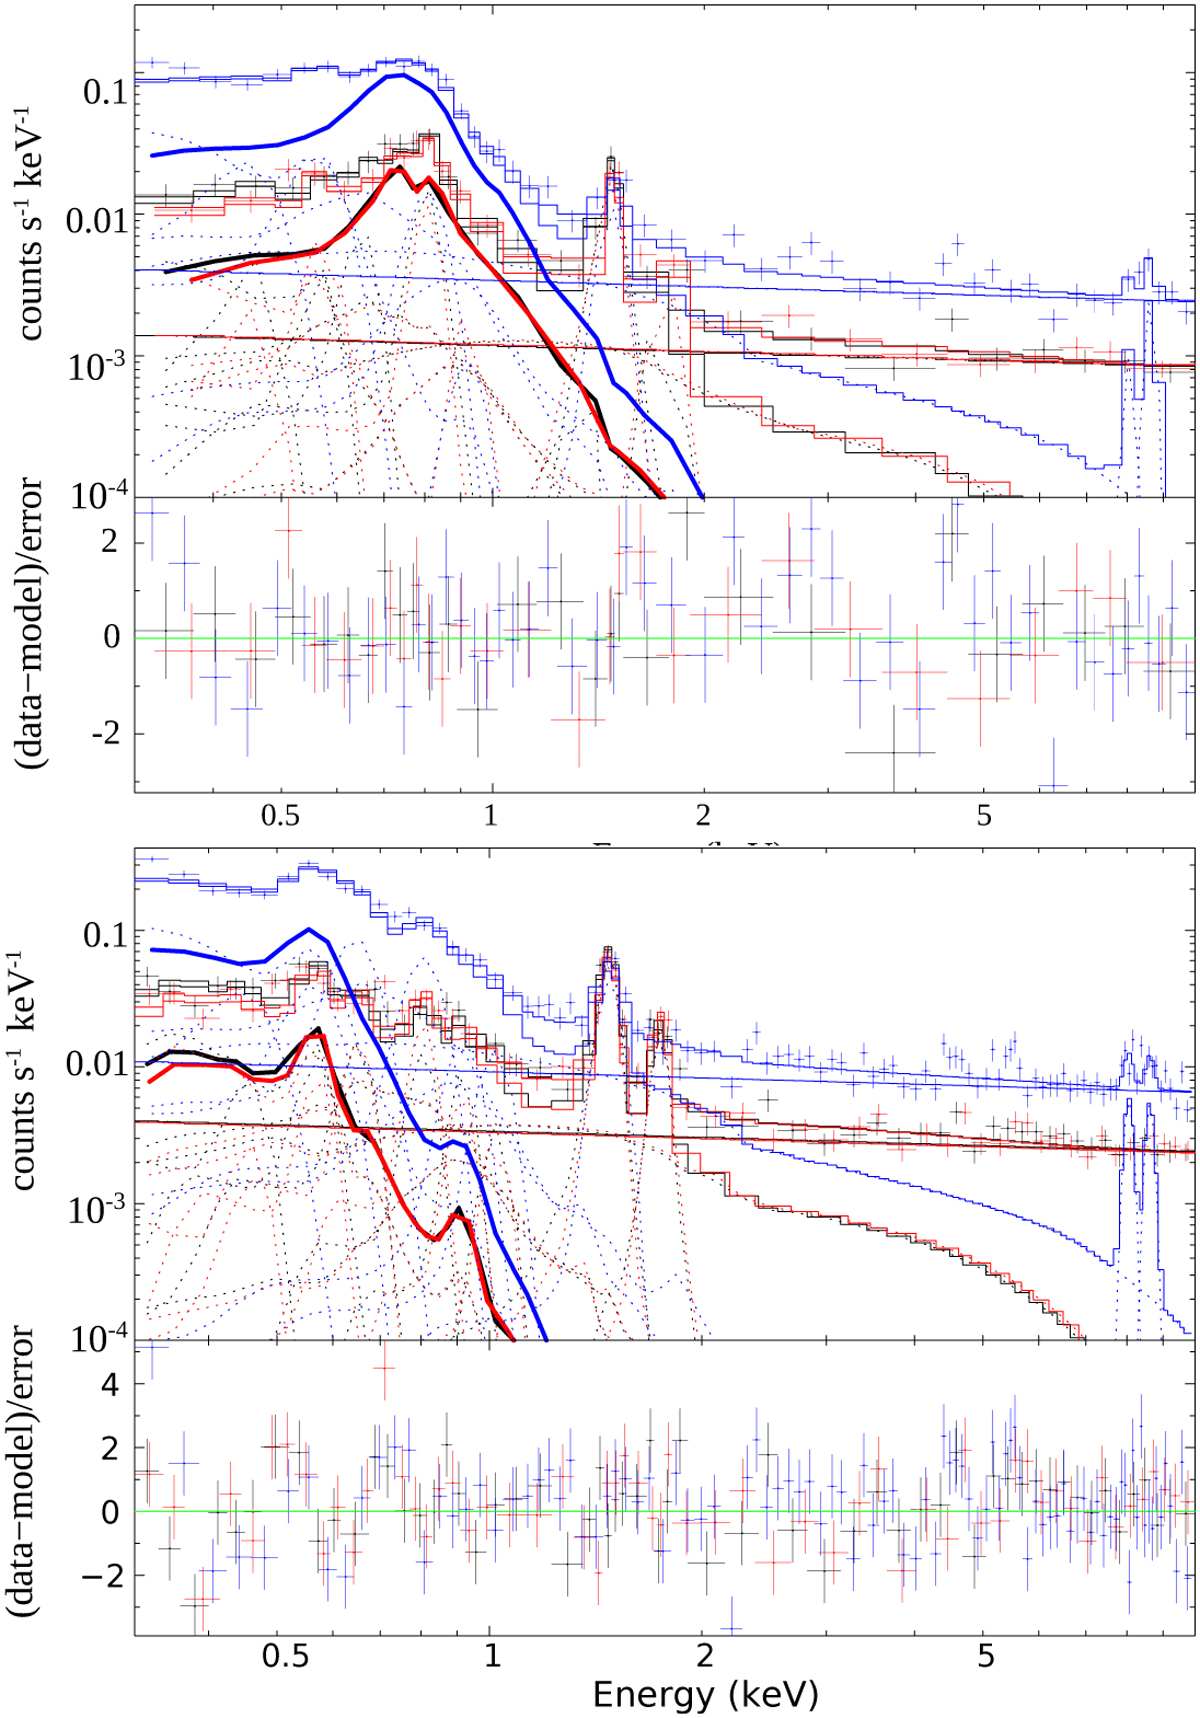
Download original image
XMM-Newton EPIC spectra of the inner circular region (top) and outer shell (bottom) of SNR J0456–6533. We plot the source spectrum (MOS1: black, MOS2: red, pn: blue) and the best-fit models. The thick solid lines show the contribution of the VNEI source emission component, which represents the emission of the SNR. All additional lines represent various background components as described in Sect. 7.
Current usage metrics show cumulative count of Article Views (full-text article views including HTML views, PDF and ePub downloads, according to the available data) and Abstracts Views on Vision4Press platform.
Data correspond to usage on the plateform after 2015. The current usage metrics is available 48-96 hours after online publication and is updated daily on week days.
Initial download of the metrics may take a while.