Open Access
Fig. 10
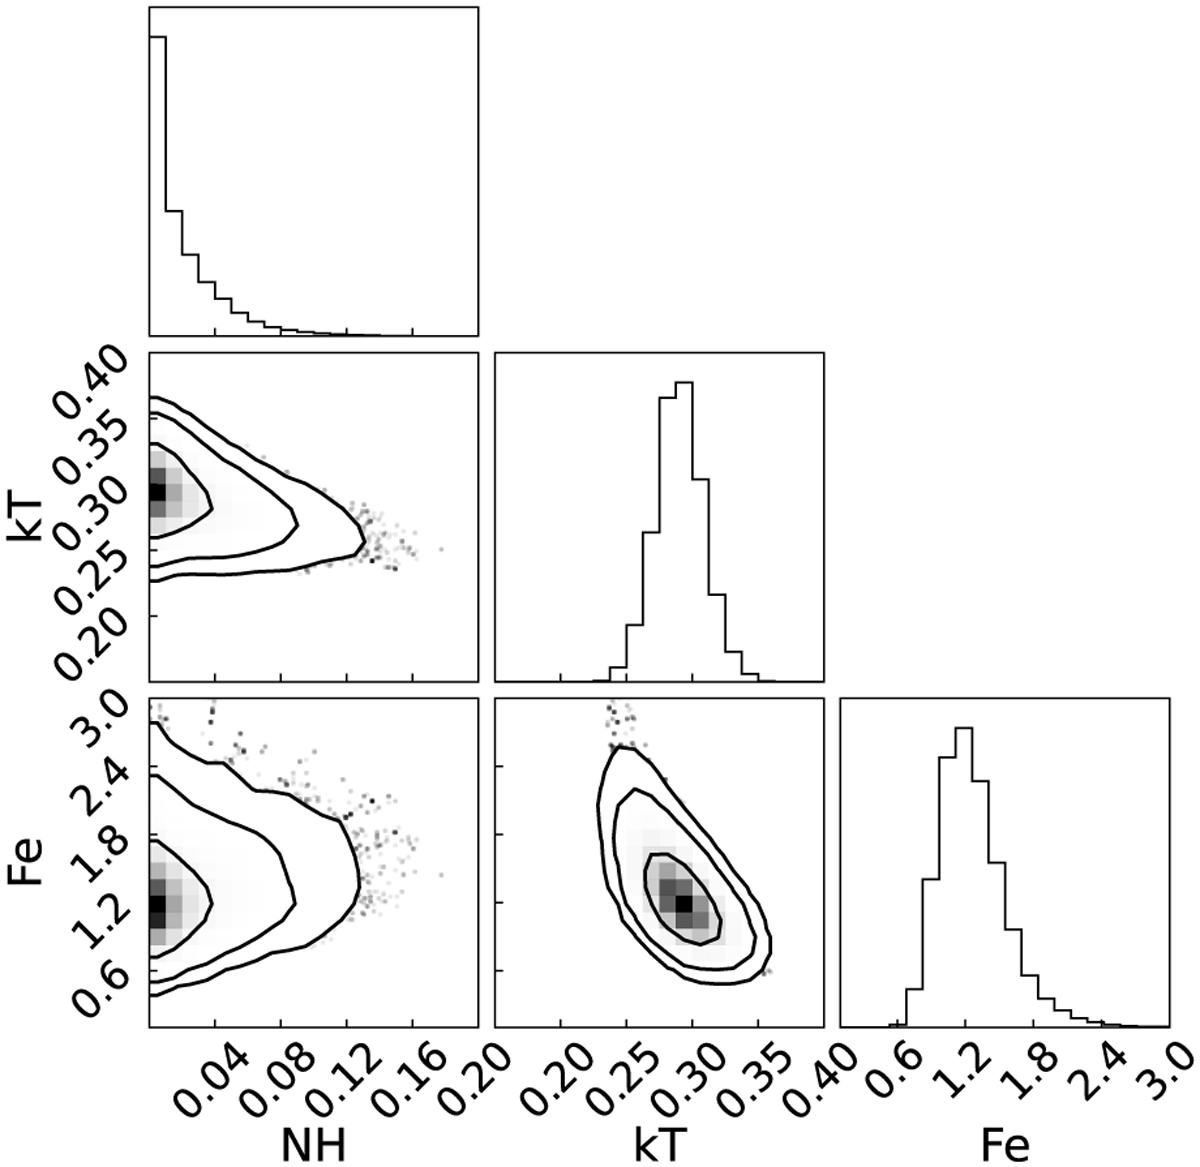
Download original image
Contour plots for the fitted parameters in the inner region of the remnant. The plotted contours are at 1, 2, and 3σ. From the contours, we measure the enhancement of Fe, which is always larger than 0.5 Z⊙ (i.e. the average abundance of ISM elements in the LMC).
Current usage metrics show cumulative count of Article Views (full-text article views including HTML views, PDF and ePub downloads, according to the available data) and Abstracts Views on Vision4Press platform.
Data correspond to usage on the plateform after 2015. The current usage metrics is available 48-96 hours after online publication and is updated daily on week days.
Initial download of the metrics may take a while.