Open Access
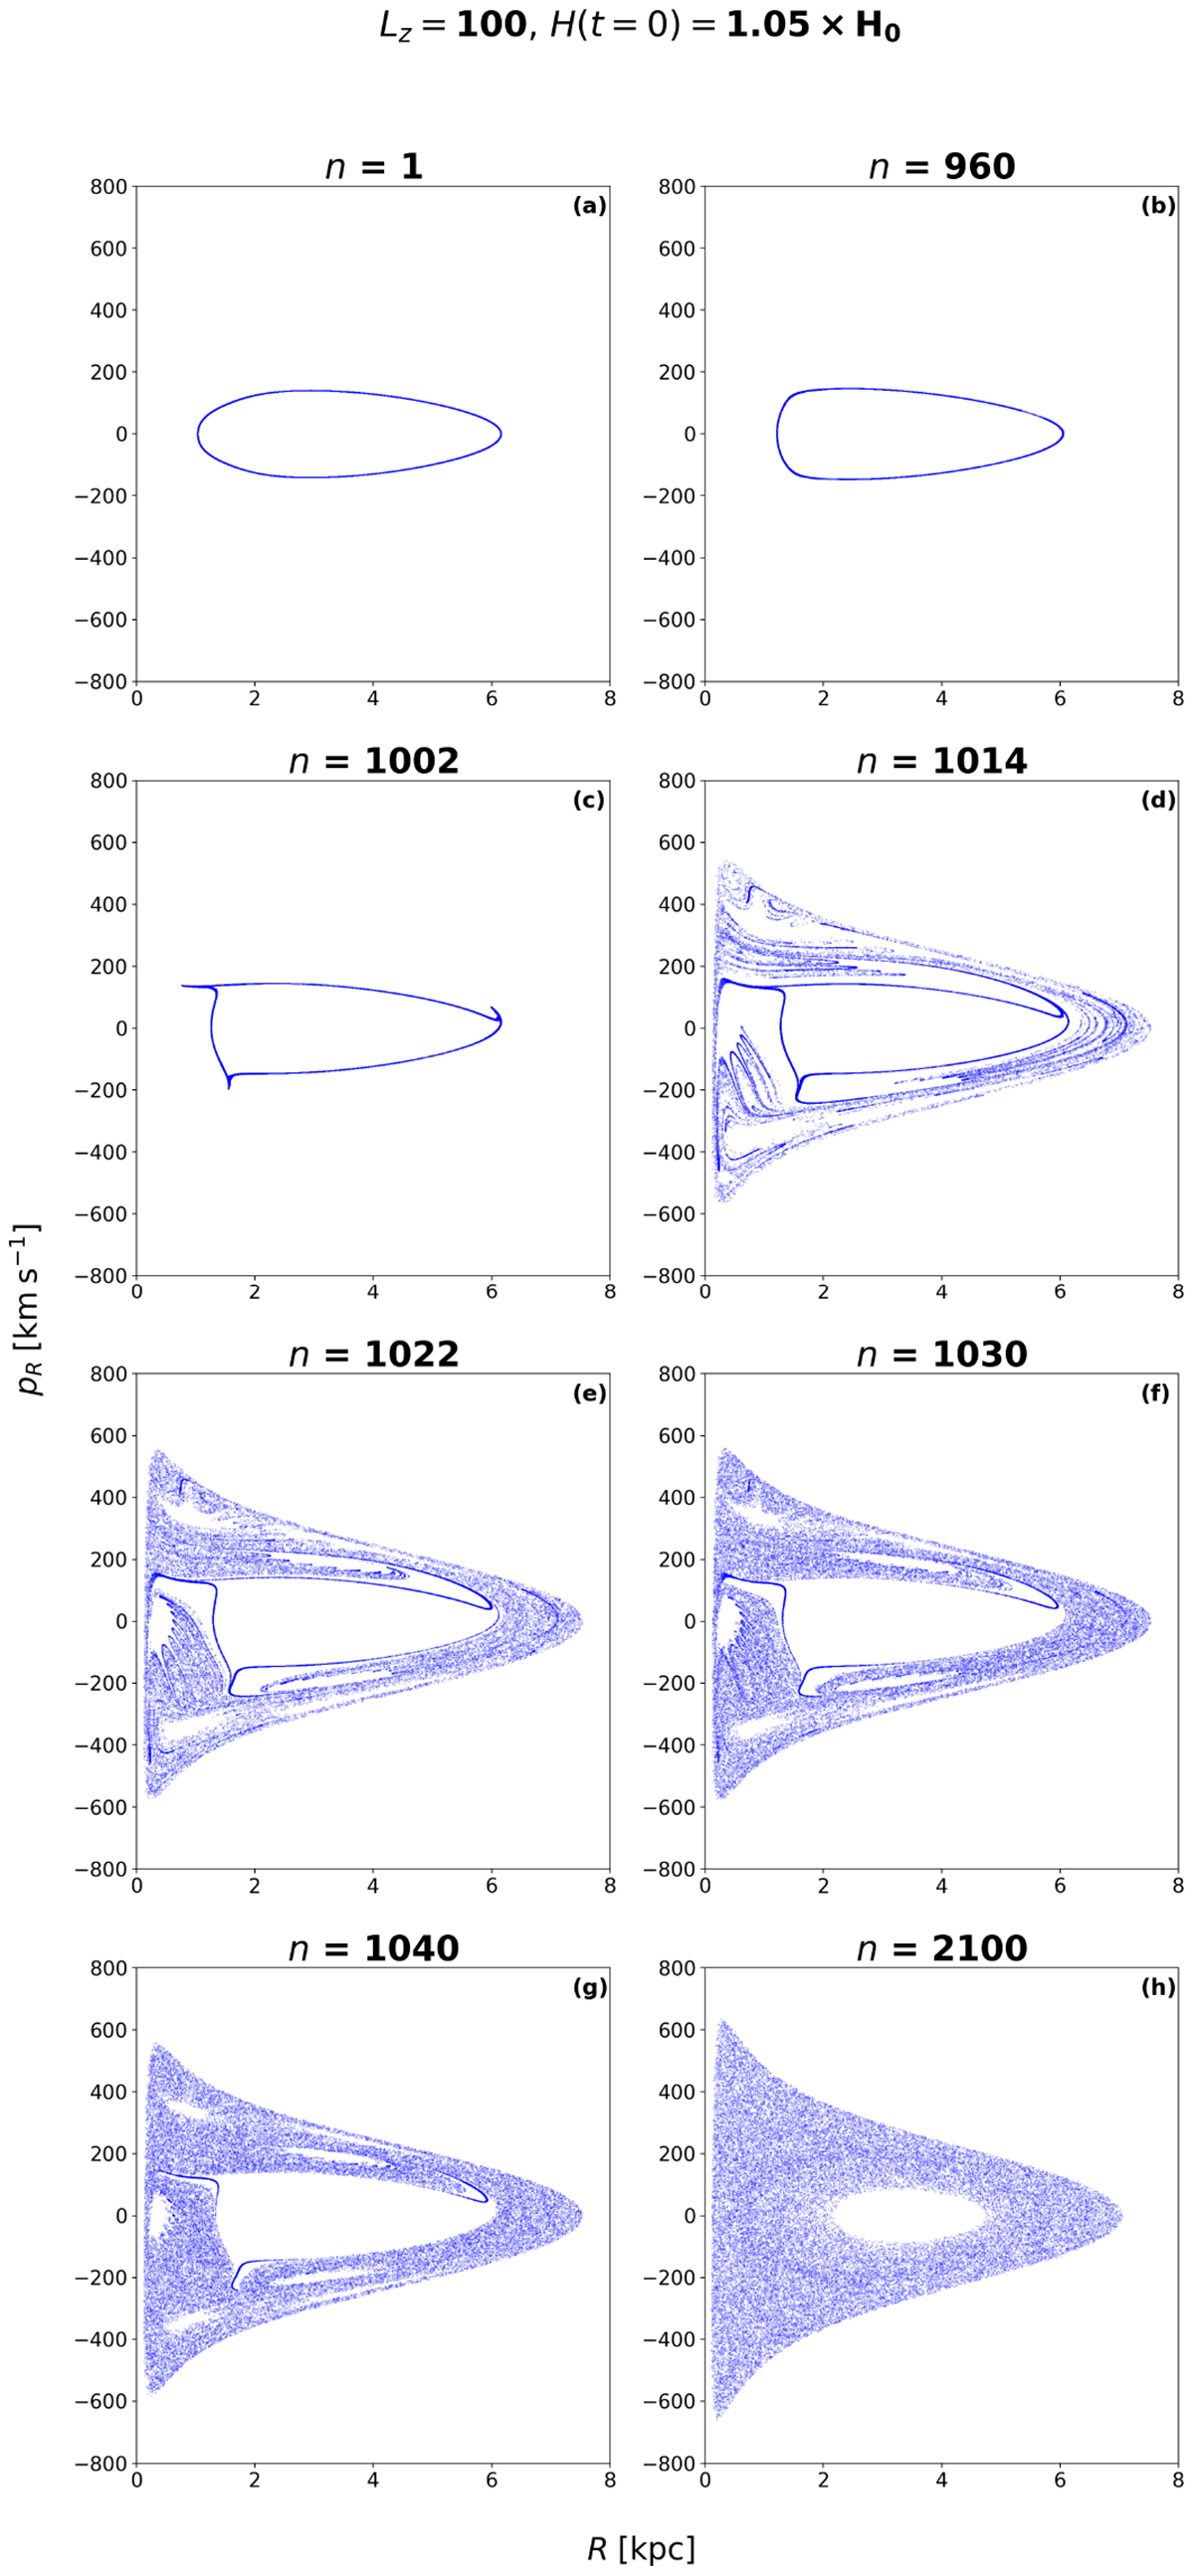
Fig. 4.
Download original image
Time evolution of the red torus on Fig. 3c. For around 1000 iterations it only deforms slightly, but at n = 1002 it starts to breakup, resulting in the dynamics of more and more trajectories of the snapshot becoming chaotic.
Current usage metrics show cumulative count of Article Views (full-text article views including HTML views, PDF and ePub downloads, according to the available data) and Abstracts Views on Vision4Press platform.
Data correspond to usage on the plateform after 2015. The current usage metrics is available 48-96 hours after online publication and is updated daily on week days.
Initial download of the metrics may take a while.