Open Access
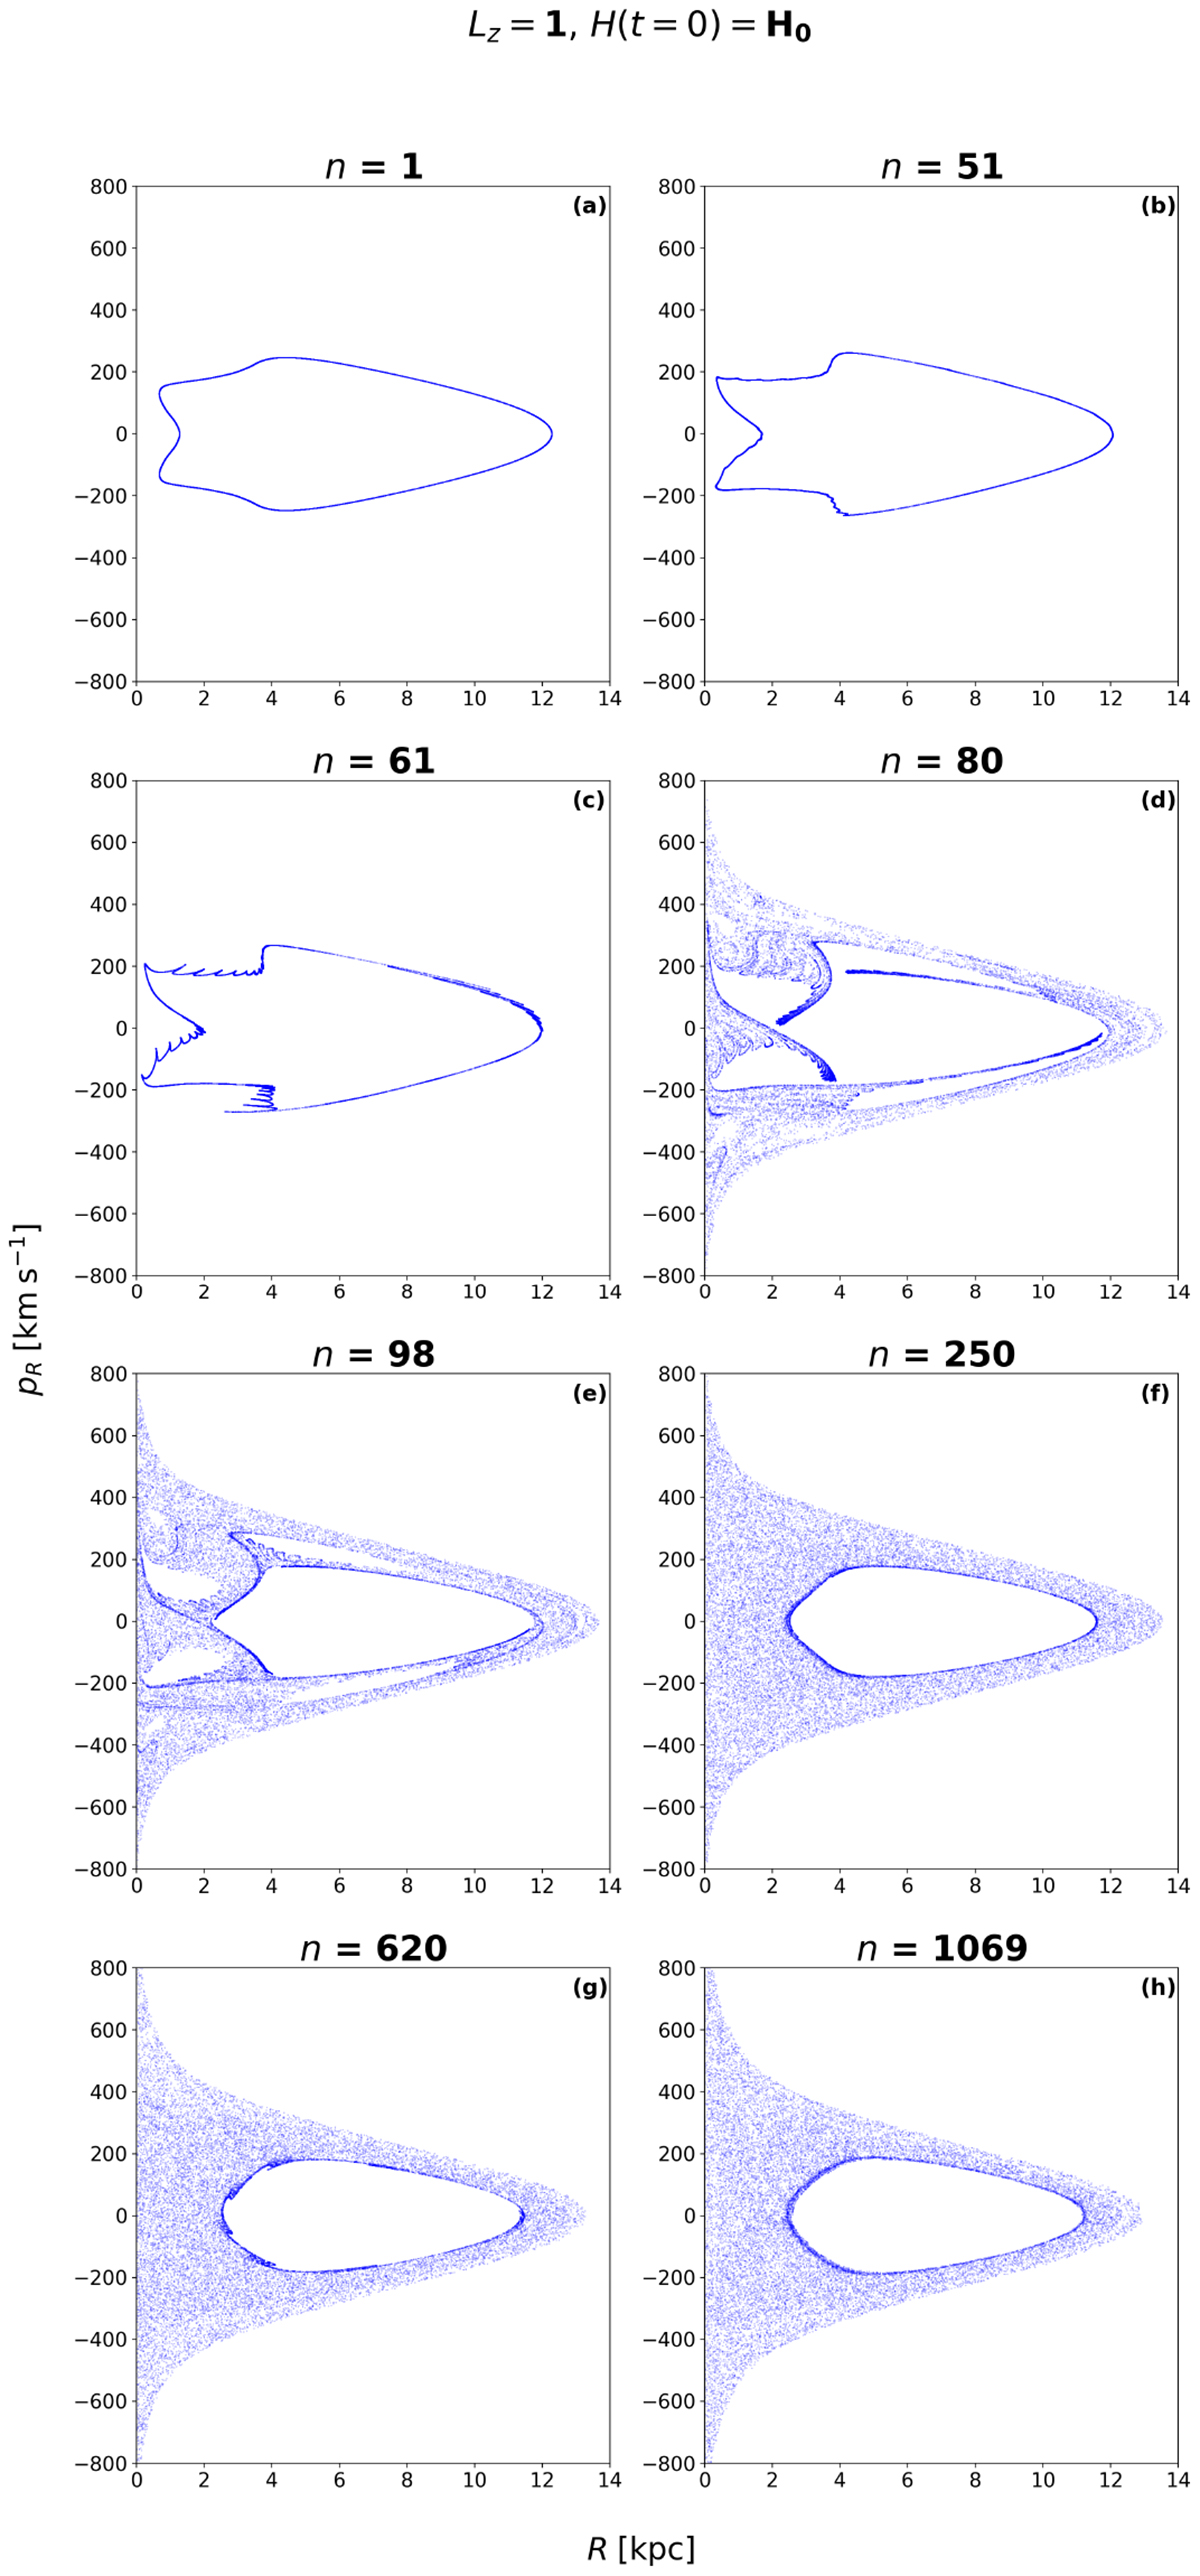
Fig. A.2.
Download original image
Time evolution of the red torus on Fig. A.1a. At n = 61 we can see the initial torus starts to deform significantly, while a small fraction of trajectories scatter out into the chaotic sea after n = 80. After n = 250 only an inner structure remains, still separating snapshot tori from the snapshot chaotic sea.
Current usage metrics show cumulative count of Article Views (full-text article views including HTML views, PDF and ePub downloads, according to the available data) and Abstracts Views on Vision4Press platform.
Data correspond to usage on the plateform after 2015. The current usage metrics is available 48-96 hours after online publication and is updated daily on week days.
Initial download of the metrics may take a while.