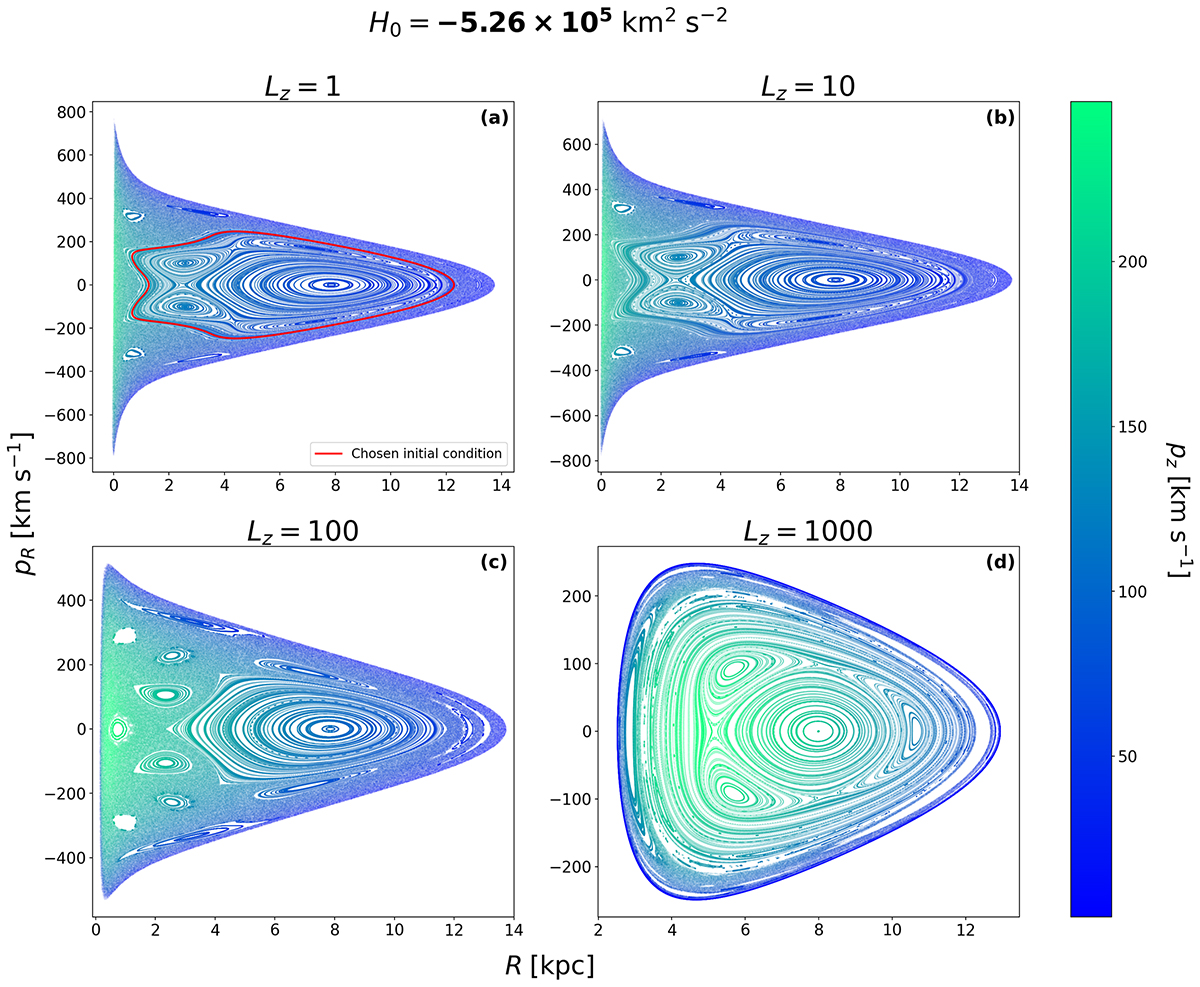
Fig. A.1.
Download original image
Phase portraits of Eq. (10) for different values of Lz with constant H = H0. The trajectories are plotted on the (R, pR) plane, following the Poincaré cut at z = 0, and the value of pz obtained from (12), indicated at each point by the colormap. The red KAM torus belongs to the initial condition R0 = 0.67, pR0 = 129.79 (panel a).
Current usage metrics show cumulative count of Article Views (full-text article views including HTML views, PDF and ePub downloads, according to the available data) and Abstracts Views on Vision4Press platform.
Data correspond to usage on the plateform after 2015. The current usage metrics is available 48-96 hours after online publication and is updated daily on week days.
Initial download of the metrics may take a while.