Fig. 1.
Download original image
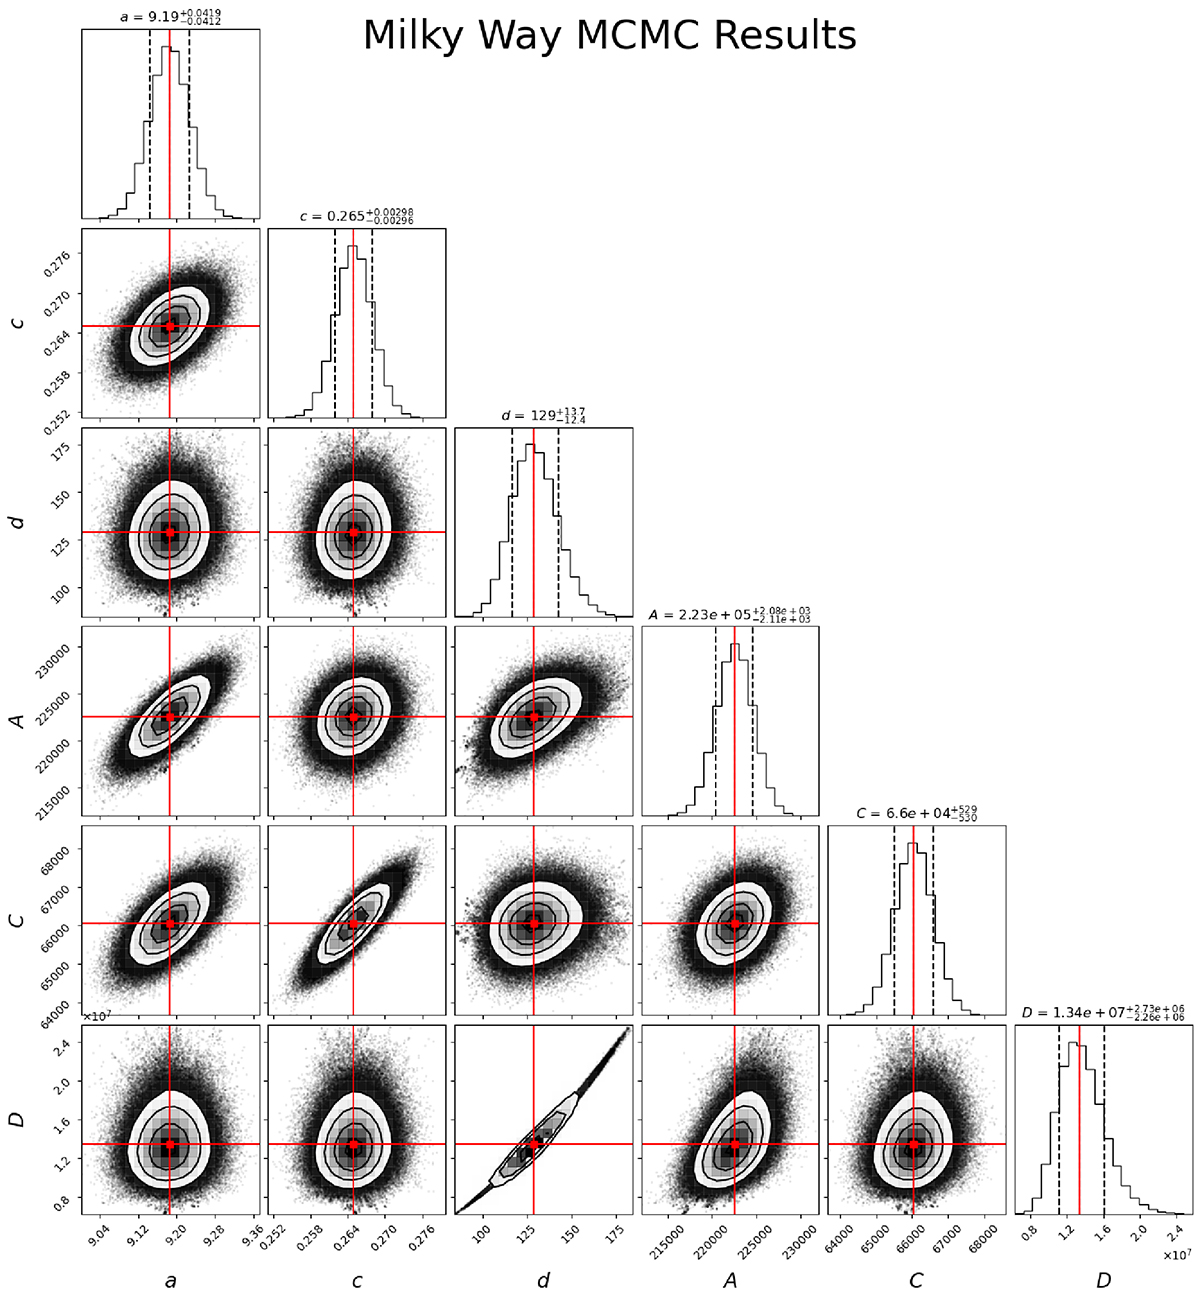
MCMC results on the gathered rotational velocity data illustrated in a corner plot. As expected, the highest correlations can be seen between the scaling distances and mass components corresponding to the same potential components. The red dots in the two-dimensional projection, along with the red lines in the one-dimensional projection, show the Maximum Likelihood estimates for the parameters, along with the black lines showing the median and 1σ confidence interval results.
Current usage metrics show cumulative count of Article Views (full-text article views including HTML views, PDF and ePub downloads, according to the available data) and Abstracts Views on Vision4Press platform.
Data correspond to usage on the plateform after 2015. The current usage metrics is available 48-96 hours after online publication and is updated daily on week days.
Initial download of the metrics may take a while.