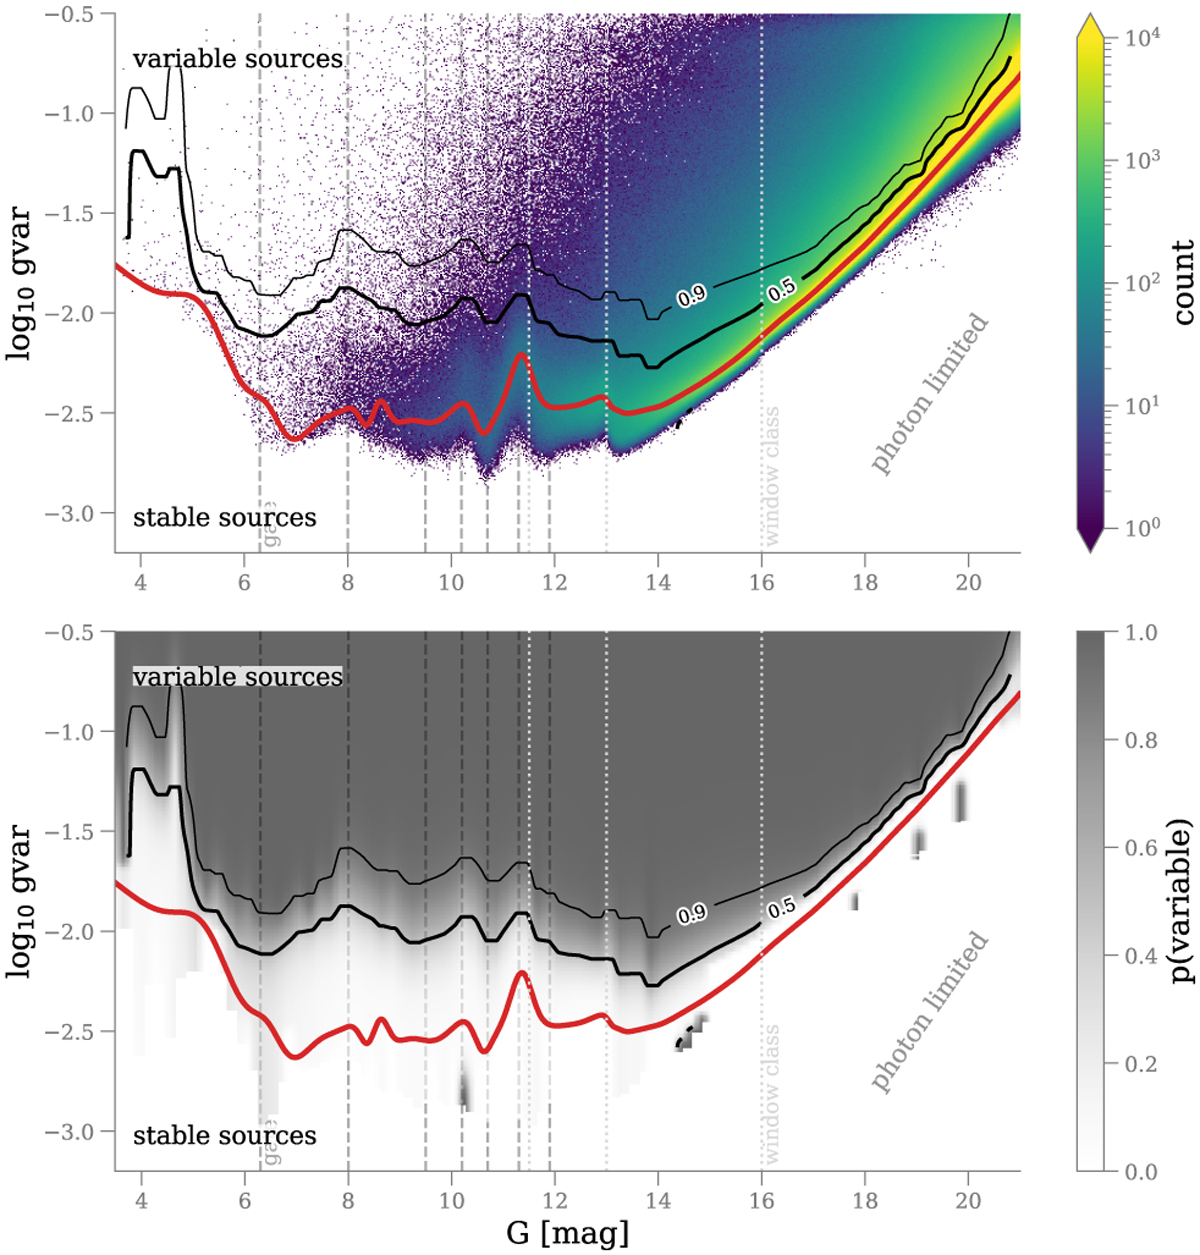
Fig. 8
Download original image
Variability distribution as a function of the G magnitude for 1 806 185 593 sources from Gaia DR3. The red line indicates our B-spline model that tracks the mean location of non-variable sources. We note that for G < 13, the photometry is affected by the gating and windowing system onboard Gaia. We indicate the approximate G magnitudes of the eleven gates with the dashed gray lines and the three window class changes resulting in overall offsets in the photometric calibration (details in Riello et al. 2021). Between these positions, the configuration affects the photometry in various manners, generating apparent wiggles and discontinuities. In DR3, the reported uncertainties include an additional calibration error on a single measurement of 2mmag corresponding to the apparent floor (log10𝑔var 2.7) at the bright end.
Current usage metrics show cumulative count of Article Views (full-text article views including HTML views, PDF and ePub downloads, according to the available data) and Abstracts Views on Vision4Press platform.
Data correspond to usage on the plateform after 2015. The current usage metrics is available 48-96 hours after online publication and is updated daily on week days.
Initial download of the metrics may take a while.