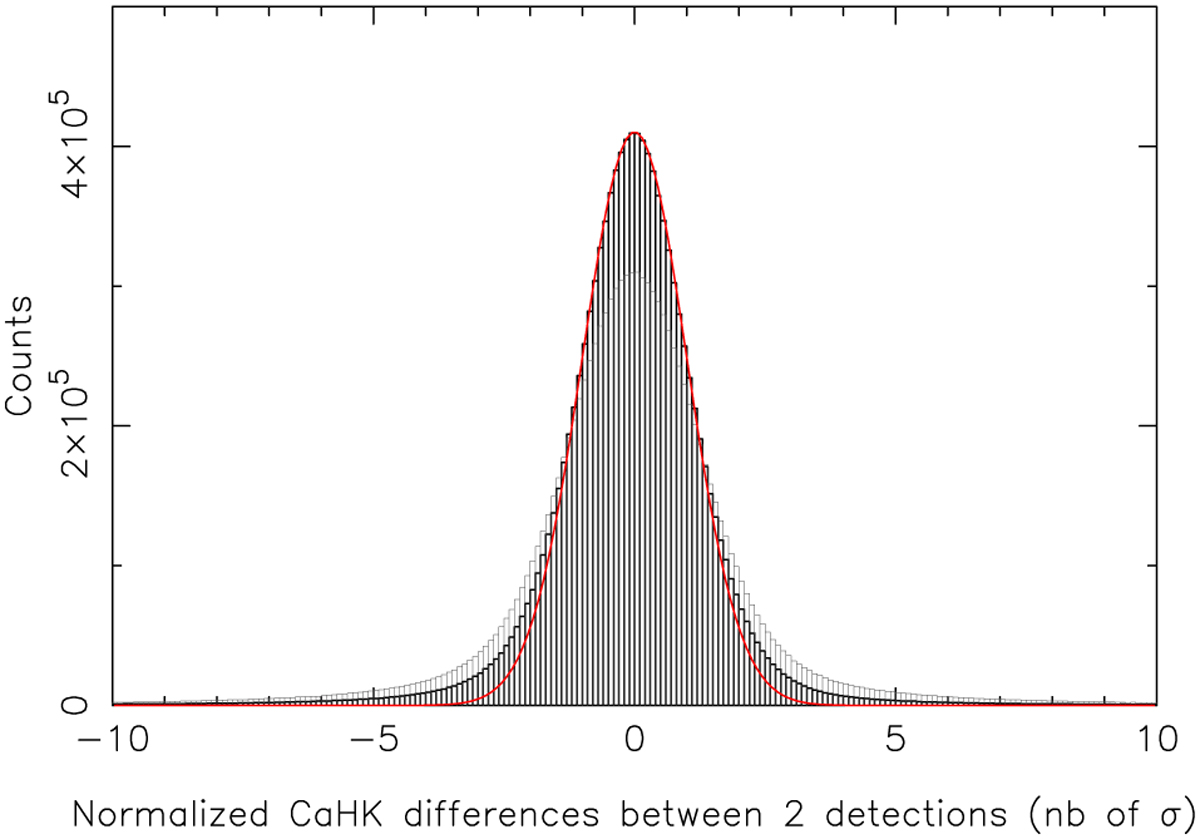
Fig. 6
Download original image
Distribution of normalized magnitude differences between repeat observations in Pristine. The gray data corresponds to the reduced, calibrated data, while the black histogram also includes a systematics uncertainty floor of 13 mmag, added in quadrature to the photometric uncertainties coming out of the pipeline. The black histogram is a good approximation of the expected distribution (red line) but shows a small fraction of objects in the tails of the distribution produced by incompatible repeat observations (variable stars, artifacts, etc.). These represent ~7.5% of repeats.
Current usage metrics show cumulative count of Article Views (full-text article views including HTML views, PDF and ePub downloads, according to the available data) and Abstracts Views on Vision4Press platform.
Data correspond to usage on the plateform after 2015. The current usage metrics is available 48-96 hours after online publication and is updated daily on week days.
Initial download of the metrics may take a while.