Fig. 8
Download original image
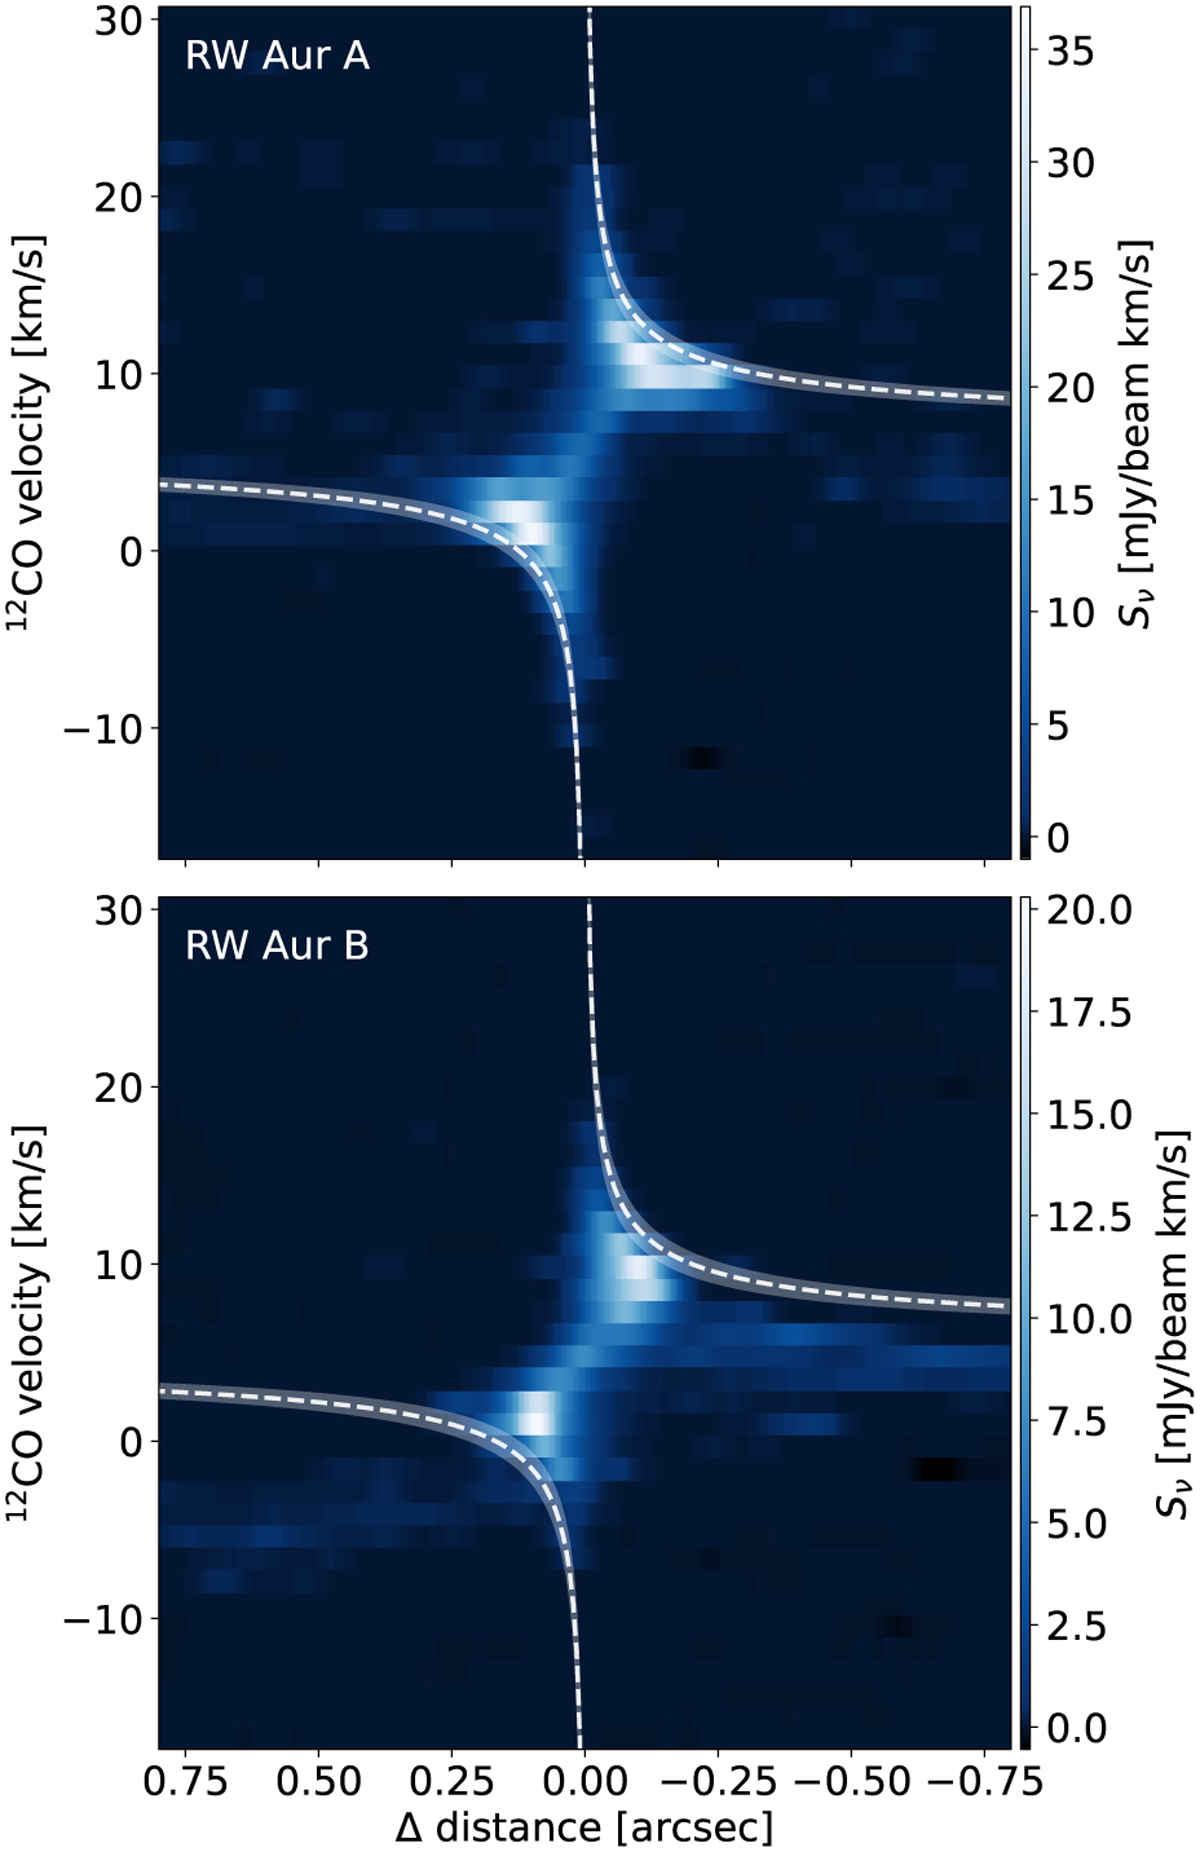
Position velocity diagram calculated from the LB12 CO cube, using the inclination and position angle obtained with the dust continuum visibility modeling along the major axis. The dashed rotation curve shows the best solution obtained with eddy, while the shaded region shows the 3σ confidence region of the rotation curve by changing the stellar mass and disk systemic velocity, as discussed in 3.6.
Current usage metrics show cumulative count of Article Views (full-text article views including HTML views, PDF and ePub downloads, according to the available data) and Abstracts Views on Vision4Press platform.
Data correspond to usage on the plateform after 2015. The current usage metrics is available 48-96 hours after online publication and is updated daily on week days.
Initial download of the metrics may take a while.