Fig. 7
Download original image
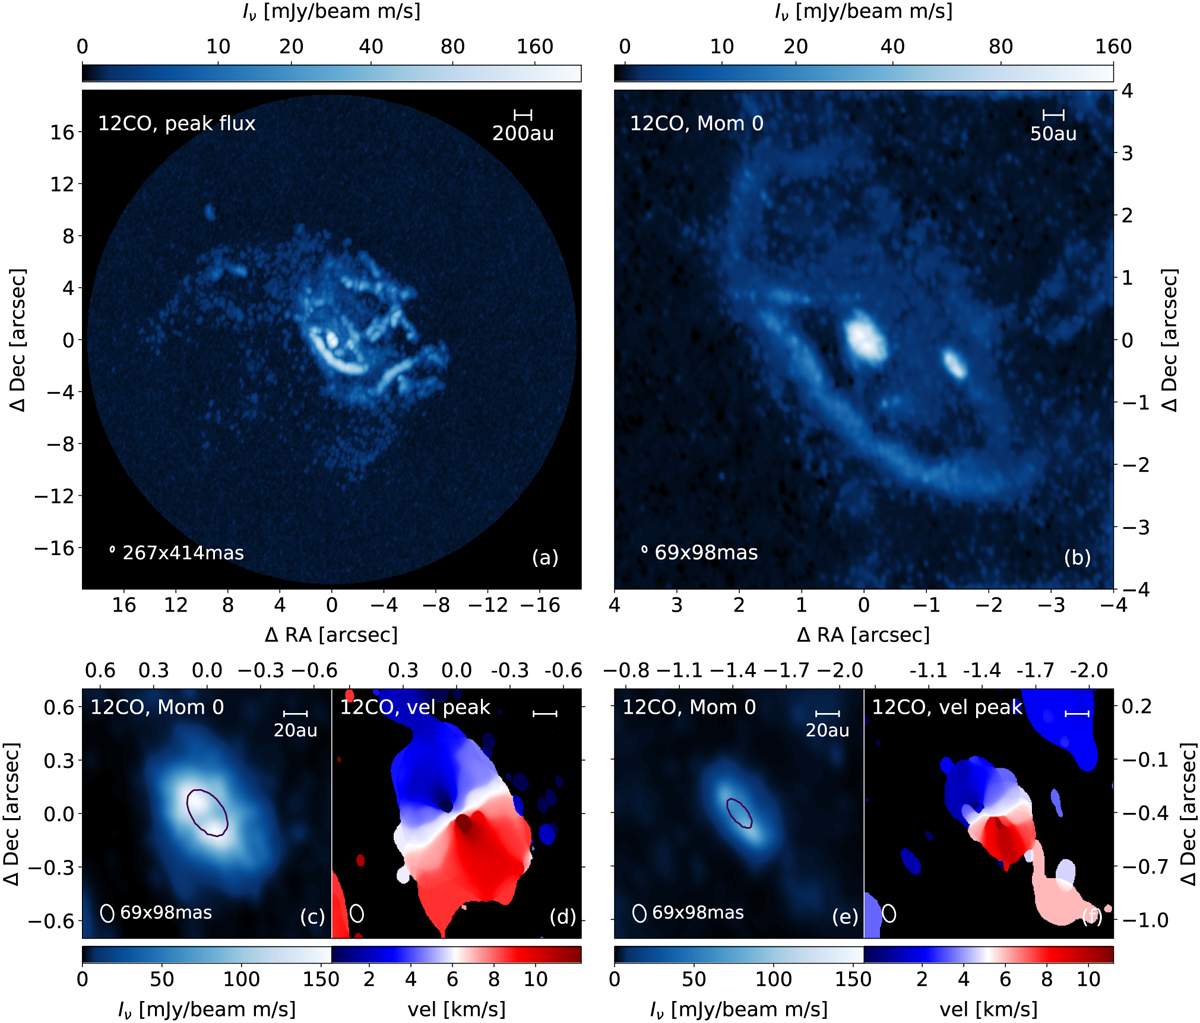
12CO emission images at different spatial scales. Panel a shows the peak emission of each pixel, imaged by combining observations SB1, SB2, and SB4. Panel b shows the moment 0 image generated by combining all the existing datasets. Panels c to f were generated by clipping the emission at 1.3 mJy beam−1 m s−1, and panels c and d are a zoom into RWAur A, while panels e and f are a zoom into RW AurB. Panels d and f show the velocity of the peak brightness emission. The color bar of the velocity at peak has been chosen so that the central velocity matches the systemic velocity of each disk. The contour in panels c and e show the 5σ dust continuum contours.
Current usage metrics show cumulative count of Article Views (full-text article views including HTML views, PDF and ePub downloads, according to the available data) and Abstracts Views on Vision4Press platform.
Data correspond to usage on the plateform after 2015. The current usage metrics is available 48-96 hours after online publication and is updated daily on week days.
Initial download of the metrics may take a while.