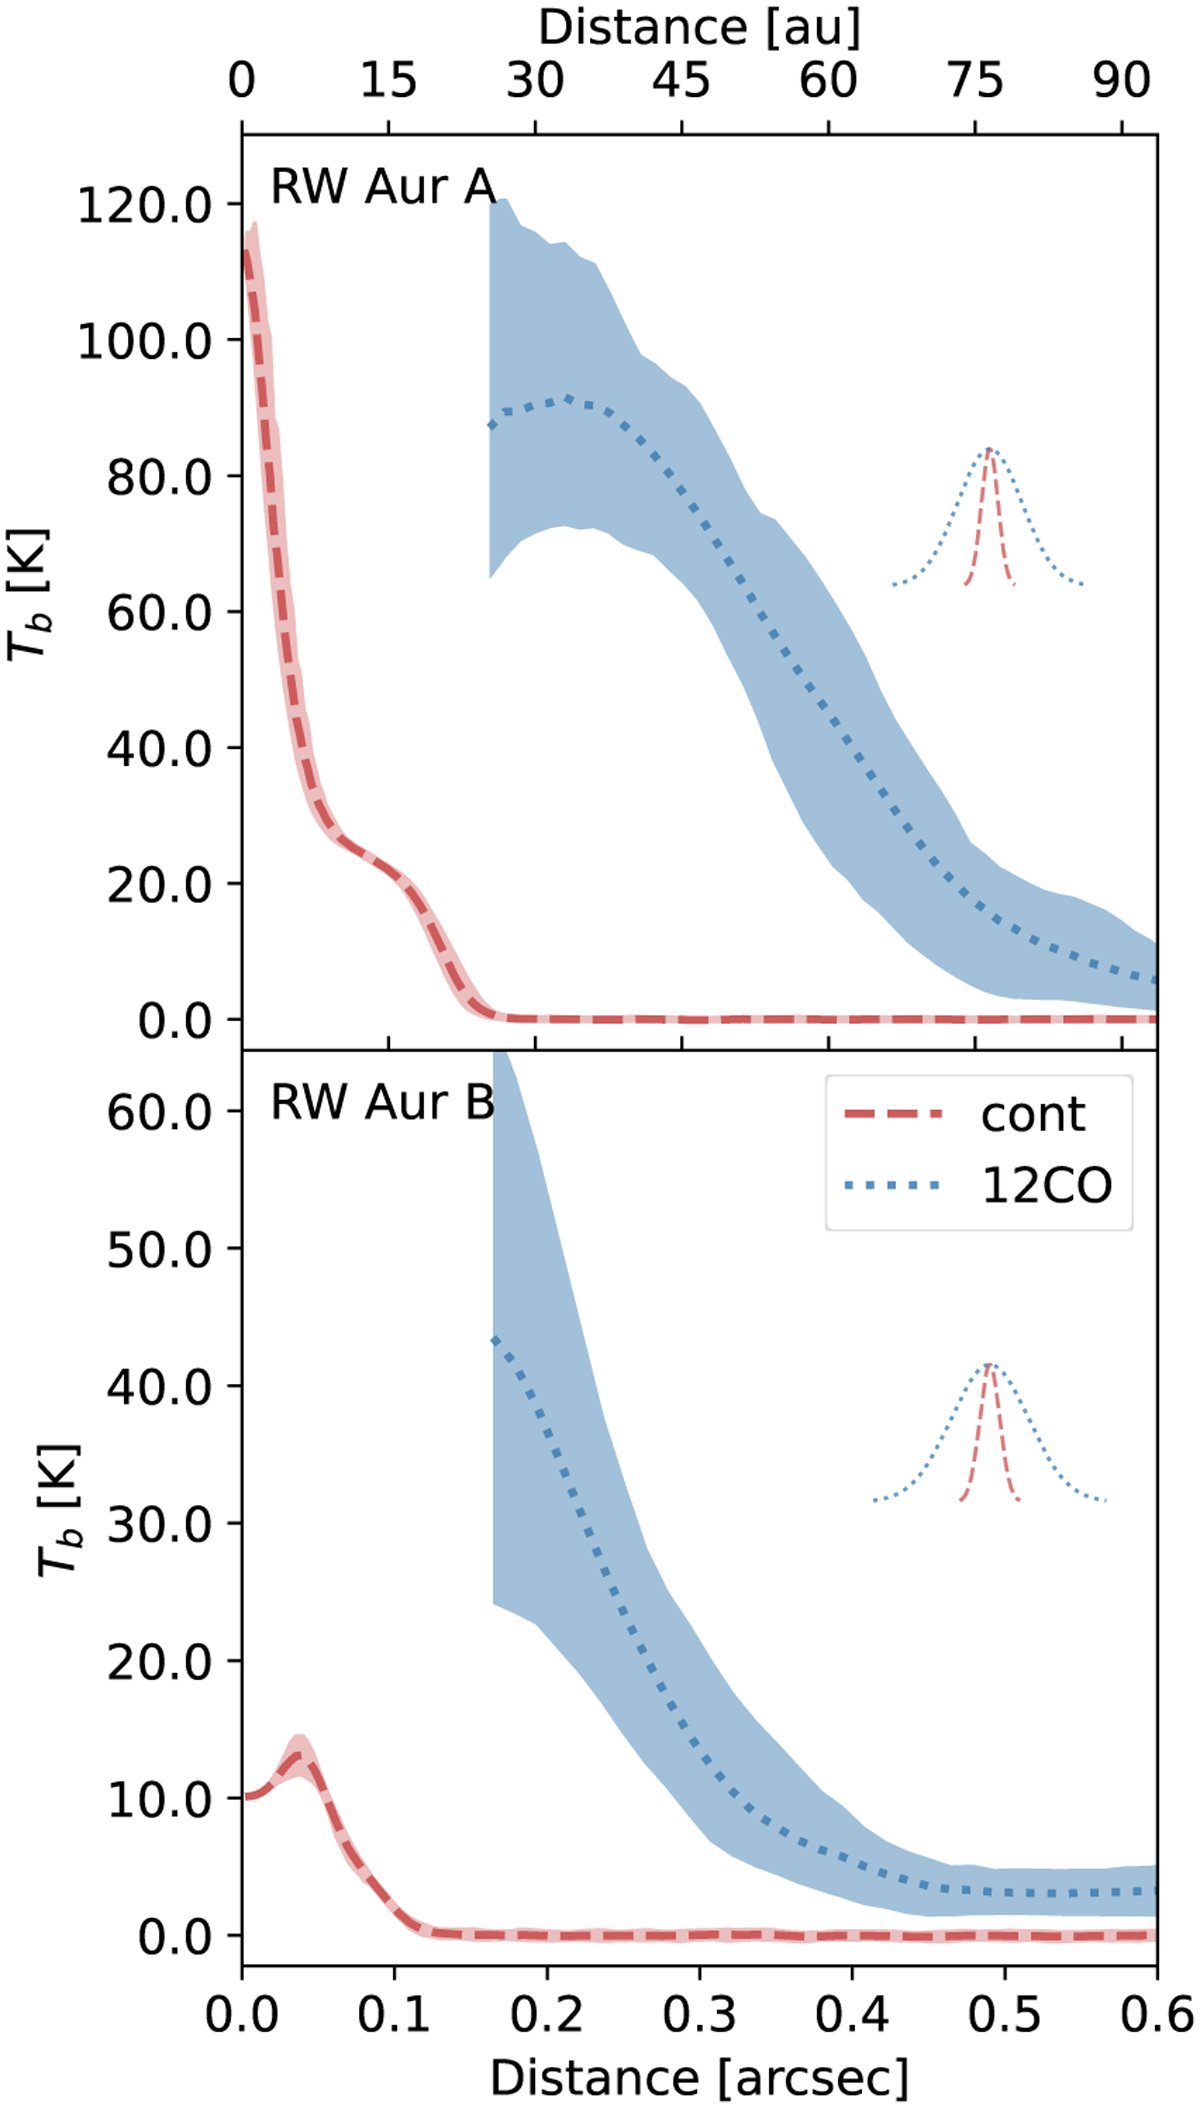
Fig. 2
Download original image
Azimuthally averaged brightness temperature profile calculated from the CLEAN image of the dust continuum shown as dashed red lines. The brightness temperature profile for the 12CO is shown as a dotted blue line, as measured from the peak brightness LB image. The inner three beams have been excluded due to the brightness dilution in the channel maps. The colored regions show the 1σ dispersion at each location. The Gaussians in the right part of each panel represent the average radial resolution of the dust continuum image and LB 12CO. The beam sizes are shown in Fig. 1 and 7.
Current usage metrics show cumulative count of Article Views (full-text article views including HTML views, PDF and ePub downloads, according to the available data) and Abstracts Views on Vision4Press platform.
Data correspond to usage on the plateform after 2015. The current usage metrics is available 48-96 hours after online publication and is updated daily on week days.
Initial download of the metrics may take a while.