Open Access
Fig. 9
Download original image
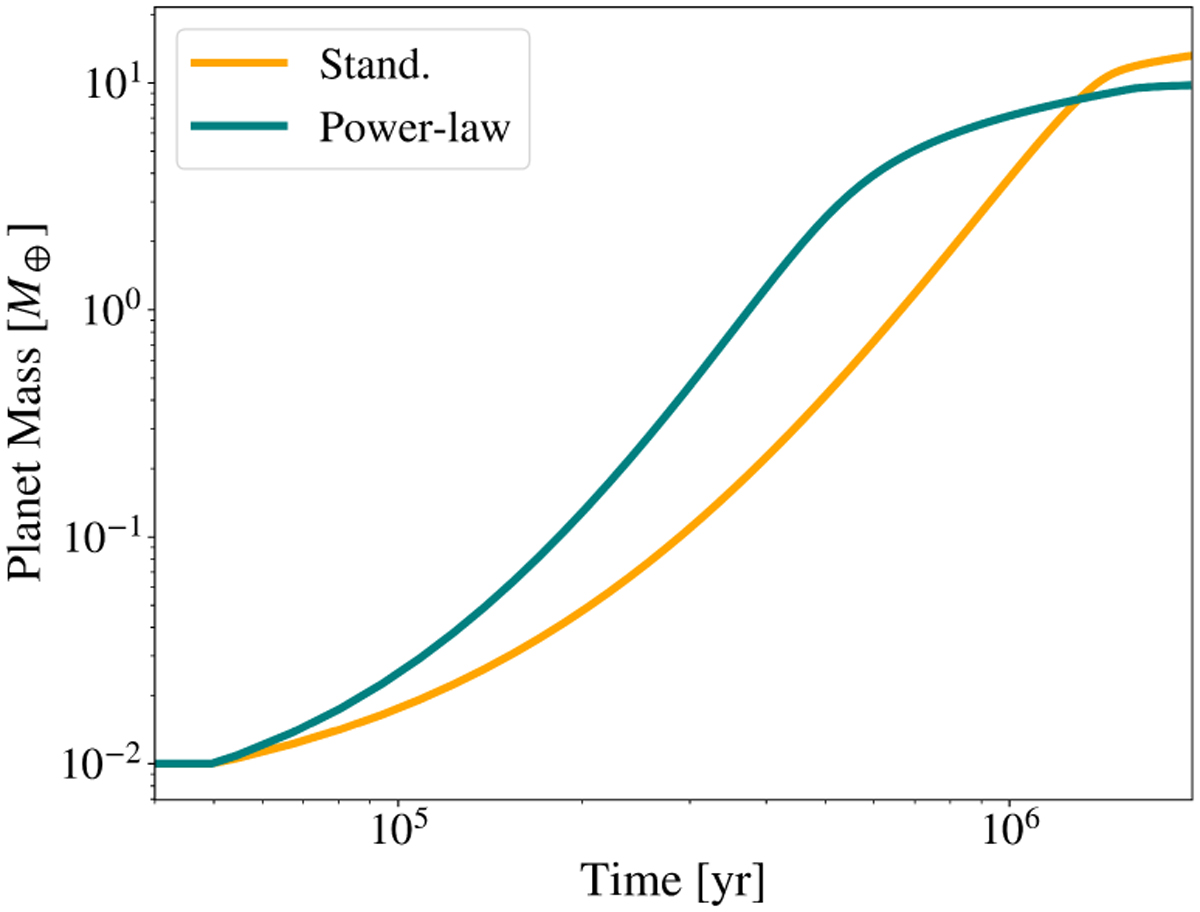
Growth of a Moon-mass embryo for α = 10−3 from the insertion time until 2 Myr, when the planet growth plateaus. The orange and teal lines show the evolution of the planet mass for the standard and powerlaw cases.
Current usage metrics show cumulative count of Article Views (full-text article views including HTML views, PDF and ePub downloads, according to the available data) and Abstracts Views on Vision4Press platform.
Data correspond to usage on the plateform after 2015. The current usage metrics is available 48-96 hours after online publication and is updated daily on week days.
Initial download of the metrics may take a while.