Fig. 2
Download original image
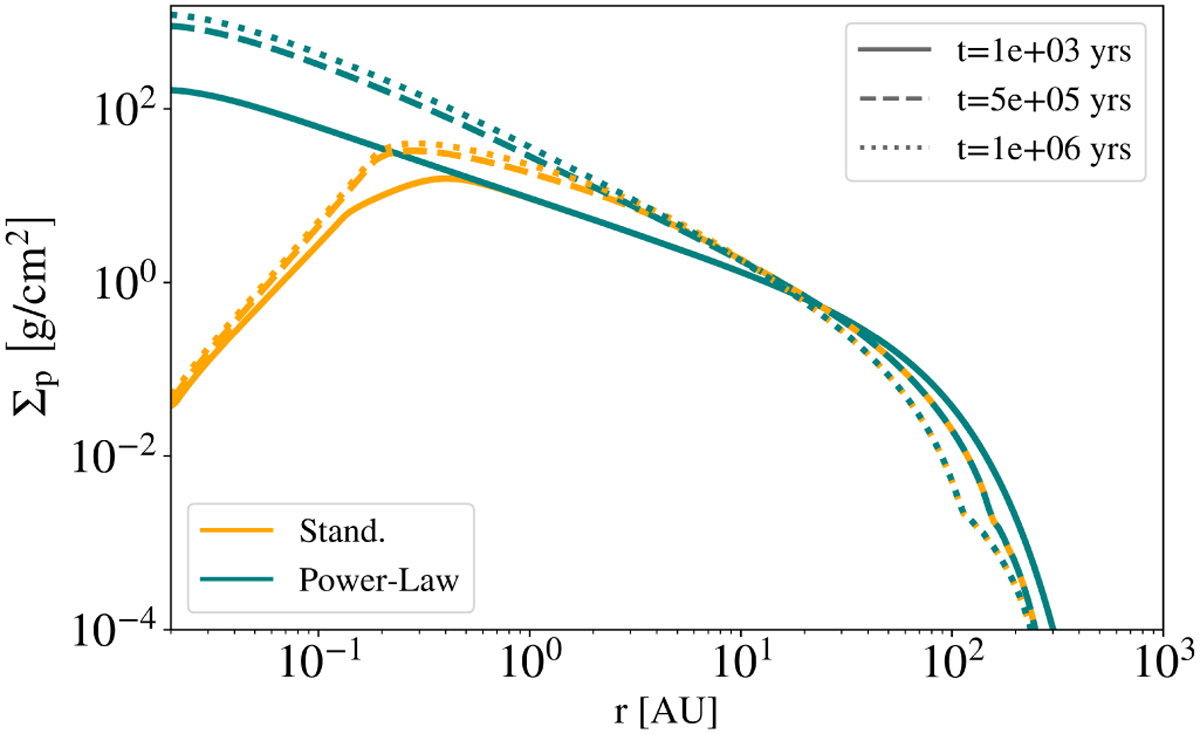
Temporal evolution of the pebble surface density as a function of radius. The solid orange and teal lines correspond to the pebble surface density for our standard and power-law cases, respectively. The orange lines show the dust-sublimation front beginning at around 0.5 AU. The solid, dashed, and dotted-dashed lines correspond to disk times of 103 years, 5 × 10⁵ years, and 1 Myr, respectively.
Current usage metrics show cumulative count of Article Views (full-text article views including HTML views, PDF and ePub downloads, according to the available data) and Abstracts Views on Vision4Press platform.
Data correspond to usage on the plateform after 2015. The current usage metrics is available 48-96 hours after online publication and is updated daily on week days.
Initial download of the metrics may take a while.